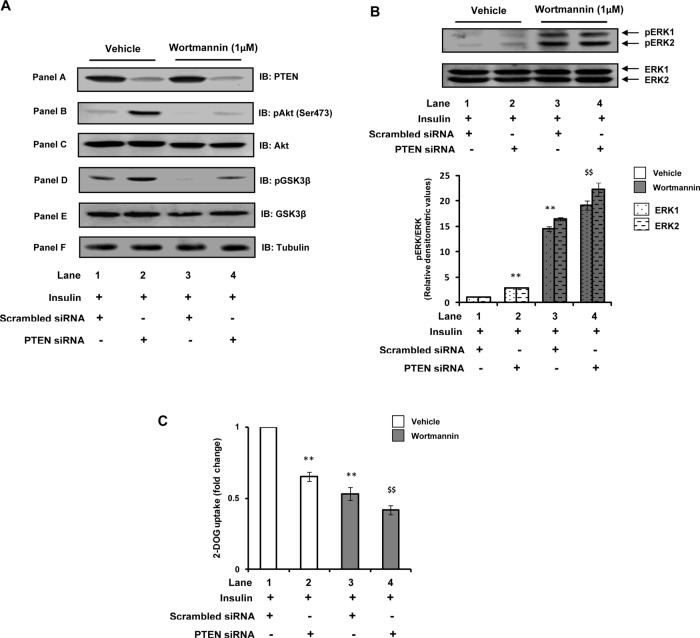
FIGURE 5:
Role of PI(3,4,5)P3 in PTEN-down-regulation–mediated activation of ERK. Scrambled or PTEN-specific siRNA–transfected N2A cells were differentiated under MF conditions for 3 d and pretreated with vehicle (DMSO) or wortmannin (1 μM) for 30 min before stimulation with insulin (100 nM) for 30 min. (A) Cell lysates were subjected to Western immunoblotting and probed with anti-PTEN (panel A), anti–phospho-Akt (Ser-473; panel B), anti-Akt (panel C), anti–phospho-GSK3β (Ser-9; panel D), anti-GSK3β (panel E), or anti-tubulin (panel F) antibodies. (B) Cell lysates were subjected to Western immunoblotting and probed with anti–phospho-ERK or anti-ERK antibodies. Bar diagram represents relative densitometric values of pERK after normalizing with ERK expression (pERK/ERK). (C) Uptake of 2-DOG was measured in 40-μg cell lysates. Uptake of each sample was measured in duplicate. Bar represents fold change in 2-DOG uptake. All experiments were repeated thrice, and a representative result is shown. Values are mean ± SE. **p < 0.01 compared with lane 1; $$p < 0.01 compared with lane 2. Open bars, vehicle; solid bars, wortmannin. IB, immunoblotted.

