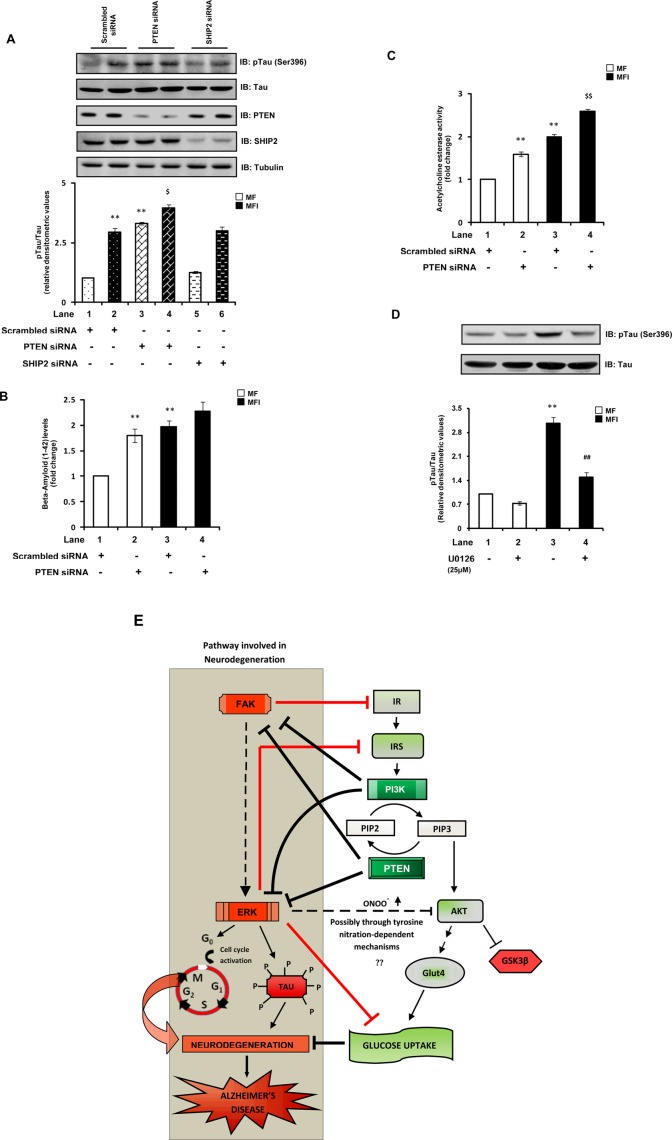
FIGURE 7:
Effect of down-regulation of PTEN on AD-associated hallmark neuropathological characteristics. Scrambled or PTEN- or SHIP2-specific siRNA–transfected N2A cells were differentiated in the absence (MF) or chronic presence (MFI) of insulin. (A) Cells were differentiated in MF and MFI media for 7 d. Cell lysates were subjected to Western immunoblotting and probed with anti–phospho-tau (Ser-396), anti-tau, anti-PTEN, anti-SHIP2, or anti-tubulin antibodies. Bar represents relative densitometric values of ptau (Ser-396) after normalizing with tau expression (ptau/tau). (B) Cells were differentiated in MF and MFI media for 7 d. Conditioned media from the last 12 h of differentiation were collected, and secreted amyloid-β (1–42) levels were measured using an amyloid-β (1–42) colorimetric ELISA kit. Bar represents fold change in amyloid-β (1–42) levels. (C) Cells were differentiated in MF and MFI media for 3 d and were subjected to acetylcholinesterase assay. Bar represents fold change in acetylcholinesterase activity. (D) N2A cells were differentiated in the absence (MF) or chronic presence (MFI) of insulin for 7 d and pretreated with vehicle (DMSO) or U0126 (25 μM) for 24 h before lysis. Cell lysates were subjected to Western immunoblotting and probed with anti–phospho-tau (Ser-396) or anti-tau antibodies. Bar represents relative densitometric values of ptau (Ser-396) after normalizing with tau expression (ptau/tau). (E) Schematic representation of molecular pathways linking neuronal insulin resistance and AD-type neurodegeneration. Arrows represent activation, whereas bars represent inhibition. All experiments were repeated thrice, and a representative result is shown. Values are mean ± SE. **p < 0.01 compared with lane 1; $p < 0.05 compared with lane 2; $$p < 0.01 compared with lane 2; ##p < 0.01 compared with lane 3. Open bars, MF; solid bars, MFI; IB, immunoblotted.

