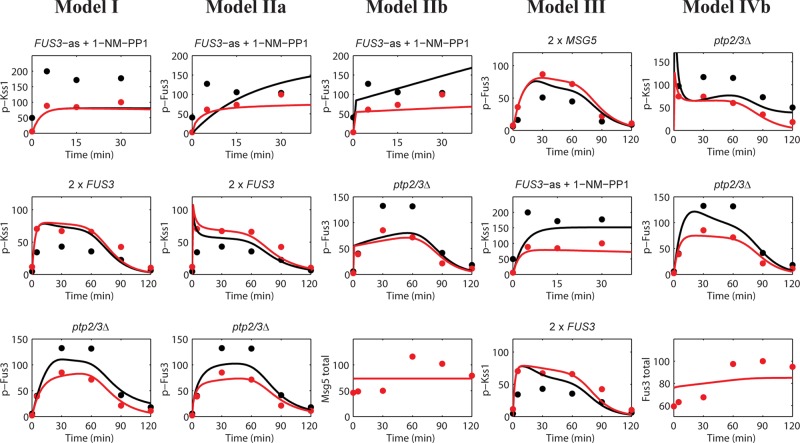
FIGURE 4:
Performance of the alternative models. The columns present illustrative results for the alternative models that demonstrate these models’ inability to capture the experimental data. Three results were selected for each model that best reflect the differences between the model and the best-performing model, model IVa (Figure 3). The results are presented in the same format as in Figure 3. The complete sets of results for each model are shown in Figures S3–S8.

