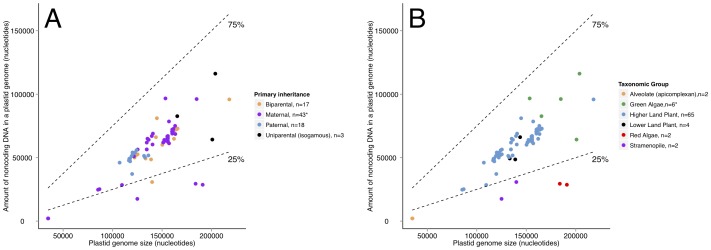
Figure 1. Amount noncoding ptDNA regressed on plastid genome size with mode of inheritance indicated and amount noncoding ptDNA regressed on plastid genome size with major taxonomic group indicated.
Dashed lines on both figures indicate the 25% and 75% bounds for percent of noncoding DNA in a plastid genome. Analysis was carried out with all taxa (n = 82), and with logged variables. *We present the raw data here with Volvox carteri not pictured for ease of visual display (n = 81).

