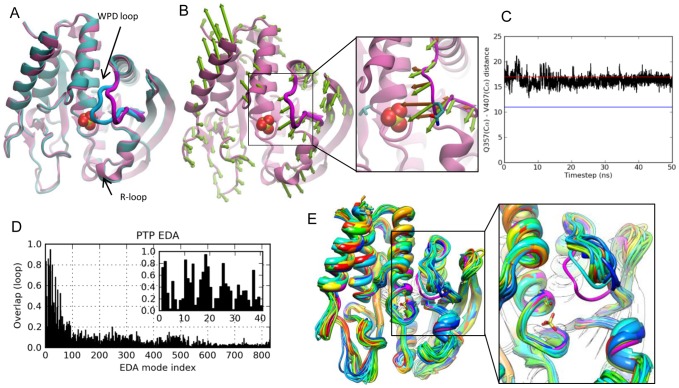
Figure 1. Results for PTP.
A. Yersinia PTP crystal structures with open/apo (mauve backbone and magenta loop; PDB id 1YPT [22]) and closed/sulfate-bound (cyan/blue loop; PDB id 1YTS [21]) conformations of WPD loop are shown.. B. ANM mode 2, the slowest mode that yields an overlap higher than 0.5 with the experimentally reconfiguration at the loop region. The close-up view compares computed (ANM2) motions (green arrows) and the structural change observed between resolved apo and liganded structures (dark orange arrows). Side-chain atoms of Gln357 (on the loop) and Val407 (at the active site) are shown in stick representation. C. Change in the distance (Å) between Gln357 and Val407 Cα atoms in the MD run, compared to the distances for closed (blue line) and open (red line) structures. D. Loop overlap between essential modes and experimentally observed reconfiguration. E. MD snapshots from every 2.5 ns, compared to the closed form (magenta) and the open (initial) form (dark blue), with the inset showing a slightly rotated, enlarged view.

