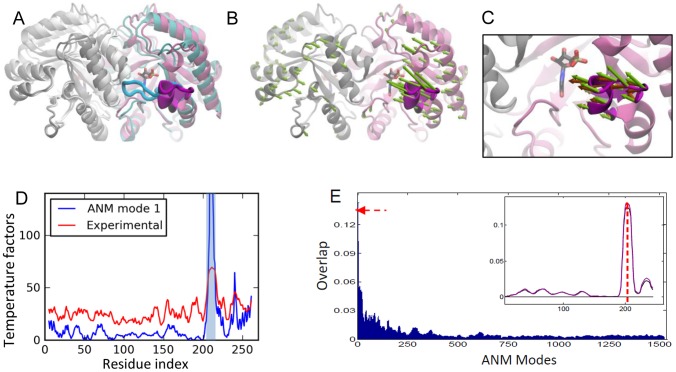
Figure 4. Results for OMP decarboxylase.
A. Open (mauve/magenta loop; PDB id 3GDK [49]) and closed (cyan/blue loop; PDB id 3GDL) forms of OMP decarboxylase are shown [49] (in color for one subunit). B. ANM mode 1 is shown by green arrows. C. A close-up view of ANM predicted loop motions compared to experimental changes (dark orange arrows). D. Theoretical temperature factors calculated using ANM1 compared to experimental B-factors reported for PDB structure 1DQW. Loop region is highlighted in light blue. E. Same as Figure 3E, for OMP decarboxylase. Curves for A (black) and B (purple) subunits shown in the inset.

