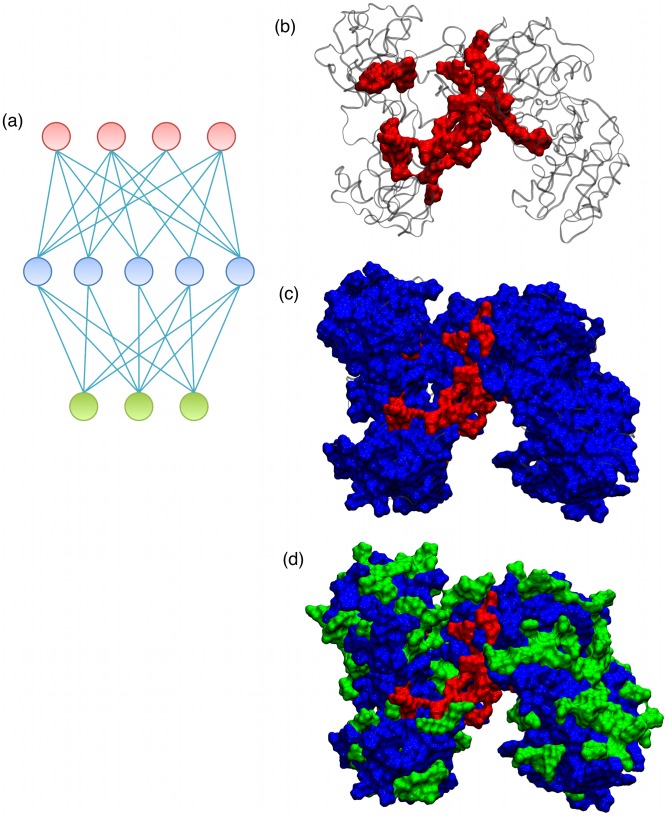
Figure 2. Illustrations of residue correlation matrix clustering.
The diagram in (a) shows three clusters. Each circle represents a single residue. The color of a given circle denotes cluster assignment. Light blue lines indicate strong residue correlation (i.e. a large Mij value; see Methods). Note that a cluster is defined by its pattern of correlations. The three illustrations (b) through (d) show each of these three cluster groupings in the TtAgo ternary complex. Note red cluster comprises the core; blue comprises the bulk, and green includes some surface residues.

