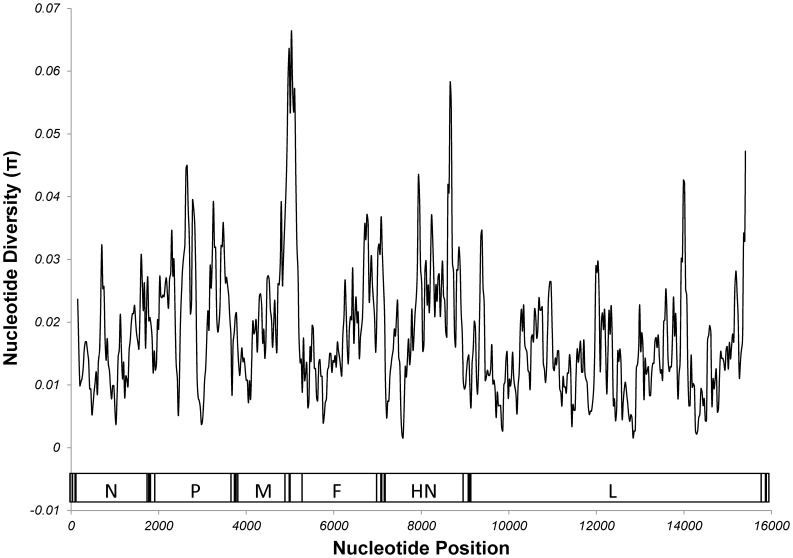
Figure 4. Sliding Scale Analysis of Nucleotide Diversity of the HPIV-1 Genome.
Analysis of nucleotide diversity was done in 100 nt windows in 25 nt increments. A table showing each window and its diversity can be seen in supplementary document 1. A schematic of the HPIV-1 genome can be found at the bottom of the figure. The coding region of each gene is labeled.

