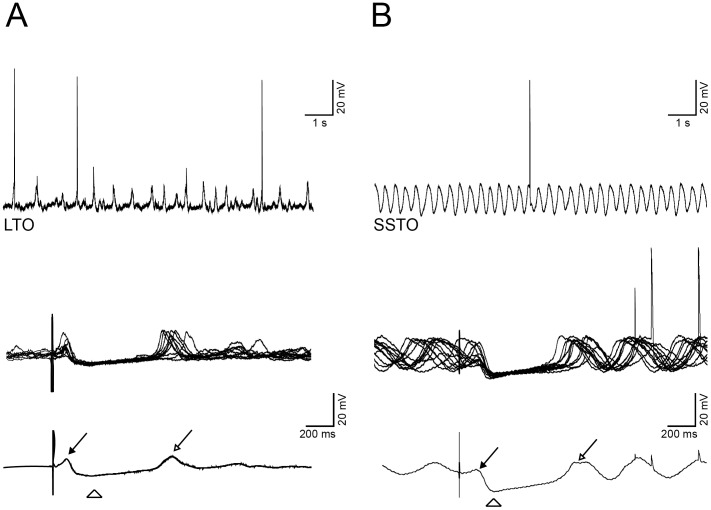
Figure 2. Differences in the response between LTO and SSTO neurons.
A: spontaneous activity of an LTO cell (top left trace), then (middle trace) the same cell is responding to CN stimulation, bottom trace shows the average of the responses. B: same experiment but in a SSTO cell. Filled arrow: short-latency EPSP, empty arrow: rebound depolarization; empty arrowhead: peak of the IPSP.

