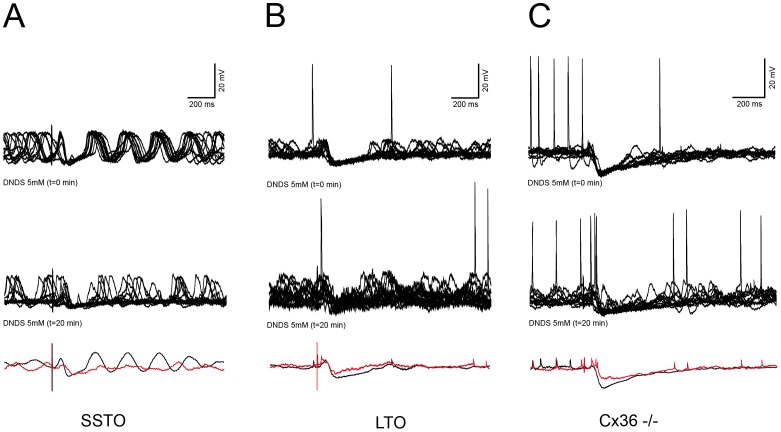
Figure 3. DNDS sensitivity in WT and Cx36 KO neurons.
A: Wild type SSTO cell (top trace) responding to CN stimulation, then (middle trace) the response of the same cell to CN stimulation in reduced after 20 minutes of dialysis with DNDS, bottom trace represents the averages at the beginning of the experiment (black) and after 20 minutes of DNDS (red). B: same as A, but in a LTO cell. C: Cx36−/− LTO cell, the response and the DNDS sensitivity are not different from the Wild type.

