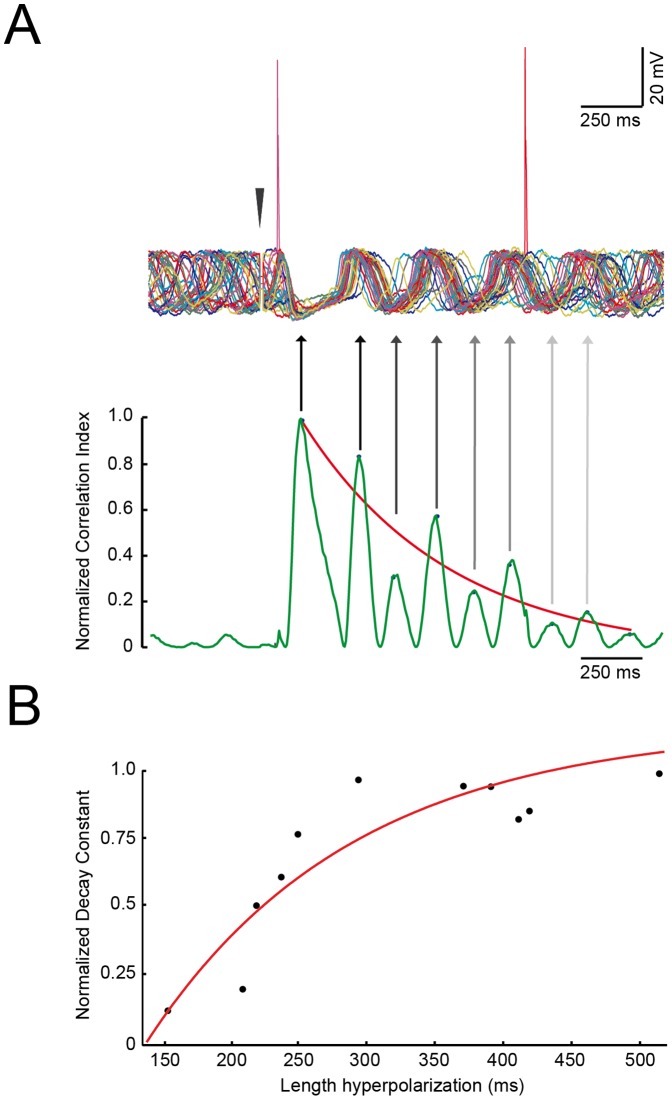
Figure 4. The length of the IPSP dictates the length of the phase reset.
A, top: overlay of 36 random-start recording from the same unit, the stimulation artifact has been removed for clarity and substituted with a red arrowhead. A, bottom: cross-correlogram of the traces in A, top, normalized values are on the left bar. Arrows indicate the correspondence of the peak in the cross-correlogram with the rough recording. Blue dots indicate the points used for the exponential fitting that is shown as a red curve. C: the decay time of the exponential fittings plotted against the length of the hyperpolarization of each SSTO neuron are fitted with an exponential function (n = 11, r2 = 0.83).

