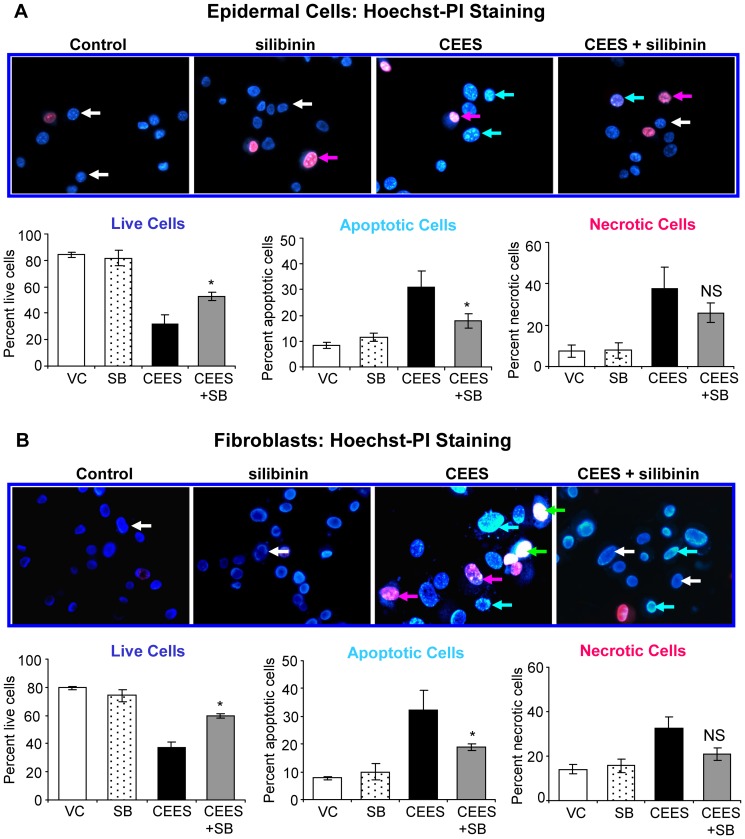
Figure 2. Silibinin reverses CEES-induced decrease in live cell number, and increase in apoptotic and necrotic cell death in skin cells.
Mouse epidermal JB6 cells (A) and fibroblasts (B) were seeded (120,000 cells/plate) and grown overnight in 60 mm petri dishes. The cells were then exposed to DMSO or 0.35 mM CEES in DMSO, or treated with either 10 µM silibinin alone or with silibinin following 30 min CEES exposure for 24 h. At the end of each treatment time, cells were collected, washed twice with 1× PBS and stained with Hoechst-PI dye at a ratio of 3∶1 as detailed under Materials and Methods. The cells were counted manually under a fluorescence microscope in at least ten random fields and percent live, necrotic and apoptotic cells were calculated as detailed under Materials and Methods. Pictures were taken at 400× magnification, and the effect of CEES and silibinin treatments are shown in the representative pictures on top of the graphs showing the quantified data. Data shown are mean ± SEM of three independent samples. *, p<0.05 as compared to CEES exposed group. White arrows, live cells-blue fluorescence and normal structure; blue arrows, early apoptotic cells- bright blue florescence and enlarged with condensed or fragmented chromatin; green arrows, late apoptotic cells- bright red (pink to white) fluorescence in the centre due to condensed chromatin; red arrows, necrotic cells-bright red fluorescence and enlarged; VC, vehicle (DMSO) control; SB, silibinin; CEES+SB, silibinin treatment 30 min after CEES exposure; NS, not significant.

