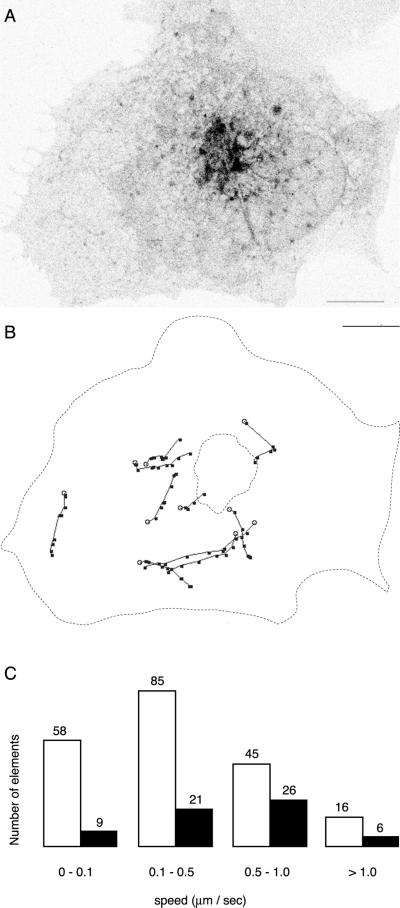
Figure 4.
Dynamics of VIP36-SP-FP trafficking in live cells. (A) Representative VIP36-SP-GFP trafficking elements in a live COS cell. VIP36-SP-GFP was transiently expressed in COS cells and imaged in the presence of 100 μg/ml cycloheximide at 37°C. The image is a single frame from a movie of single confocal sections taken at the level of the ER. Trafficking structures consist of peripheral globular elements (blobs) and tubular elements (tubules). The frequency and behavior of blobs and tubules varies somewhat from cell to cell; movies in the online data depict the range of behavior observed. Bar, 10 μm. (B) Manual tracking of discreet VIP36-SP-GFP trafficking elements observed in the cell in A. The most distinct elements were tracked frame by frame. Black dots indicate the position of the element every 3.3 s. If the element extended or changed shape from frame to frame, the dot indicates the leading edge of the element in the direction of travel. Open circles indicate the initial position of the element. Scale same as A. (C) Distribution of speeds derived from manual tracking of discreet VIP36-SP-GFP trafficking elements. Trafficking elements in 18 independent cells were classified as blobs (open bars) or tubules (closed bars) and their average speed calculated (see MATERIALS AND METHODS). The exact number of elements each bar represents is indicated above the bar.

