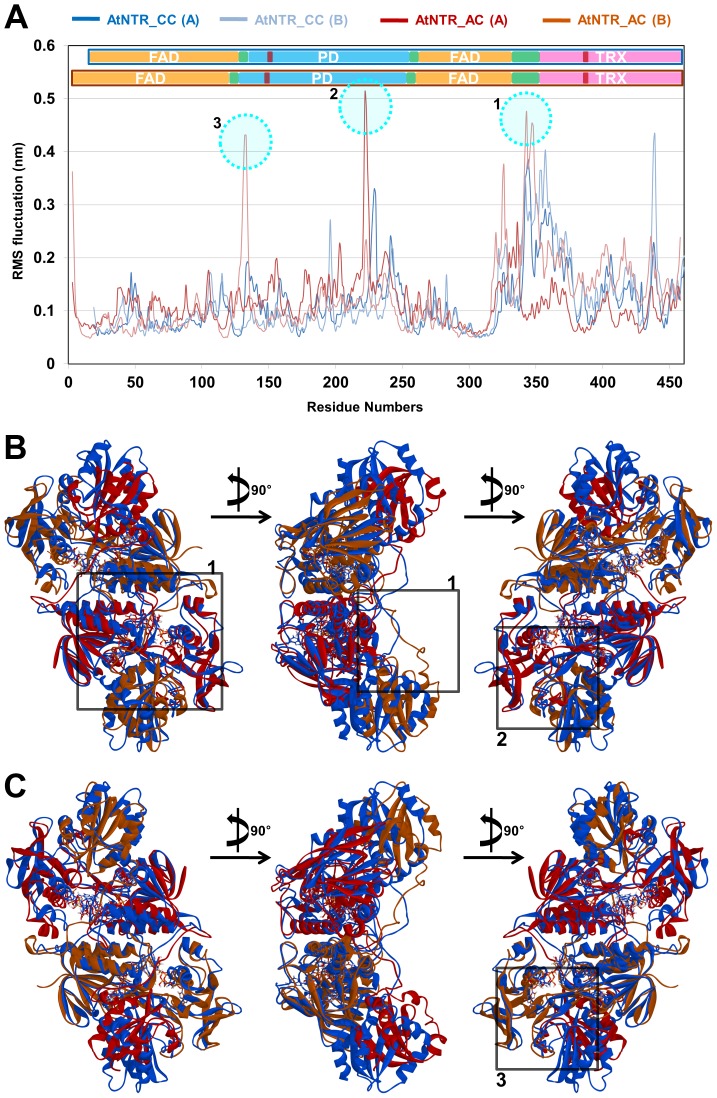
Figure 6. RMSF and entire structure differences with the most fluctuated regions.
(A) The most flexible regions such as F342-K350 (of the linker region in subunit B), D221-R225 (of PD in subunit A), and G130–G134 (of PD in subunit B) in AtNTR_AC are emphasized by dotted circle in the RMSF plot. (B) Superimposed structures of two proteins by NTR regions. To clearly show the structural difference of the proteins, all subunits in AtNTR_CC are colored by blue and subunit A and B in AtNTR_AC is colored by red and light brown, respectively. The most flexible regions are highlighted by square block with corresponding numbers. (C) Vertically inverted view of figure 5E with numbered square block indicating the third flexible domain region.

