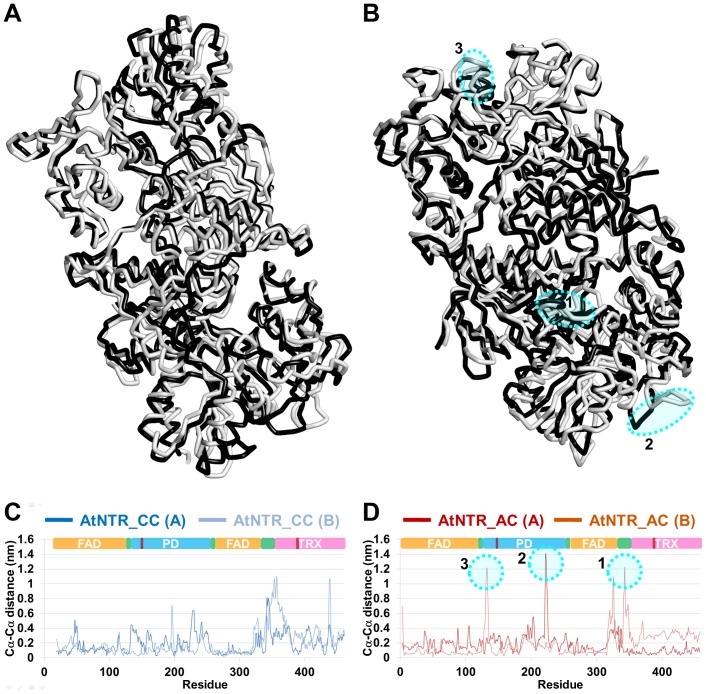
Figure 8. Essential dynamics analysis for the two systems.
The two trace structures (minimum in white color and maximum in black color) from the maximal and minimal projections along the largest eigenvector are superimposed in each system, (A) AtNTR_CC and (B) AtNTR_AC. The largest correlated motion for the linker region is emphasized by dotted circle. The Cα-Cα distance plots between the superimposed structures of (C) AtNTR_CC system and (D) AtNTR_AC system are also given to provide quantitative difference values.

