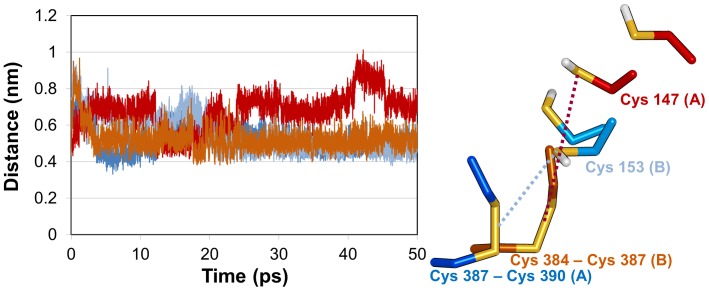
Figure 10. Distance between key cysteine residues.
Distance graph (in left) of catalytic sulfide atoms for electron transfer in AtNTR_CC (blue) between Cys153:S (in subunit B) and Cys387–Cys390:S-S (in subunit A) and for that in AtNTR_AC (red) between Cys147:S (in subunit A) and Cys384–Cys387:S-S (in subunit B). In the right panel, the key catalytic residues are represented by stick model.

