
Figure 1. Hearing loss after exposure to simulated gunfire.
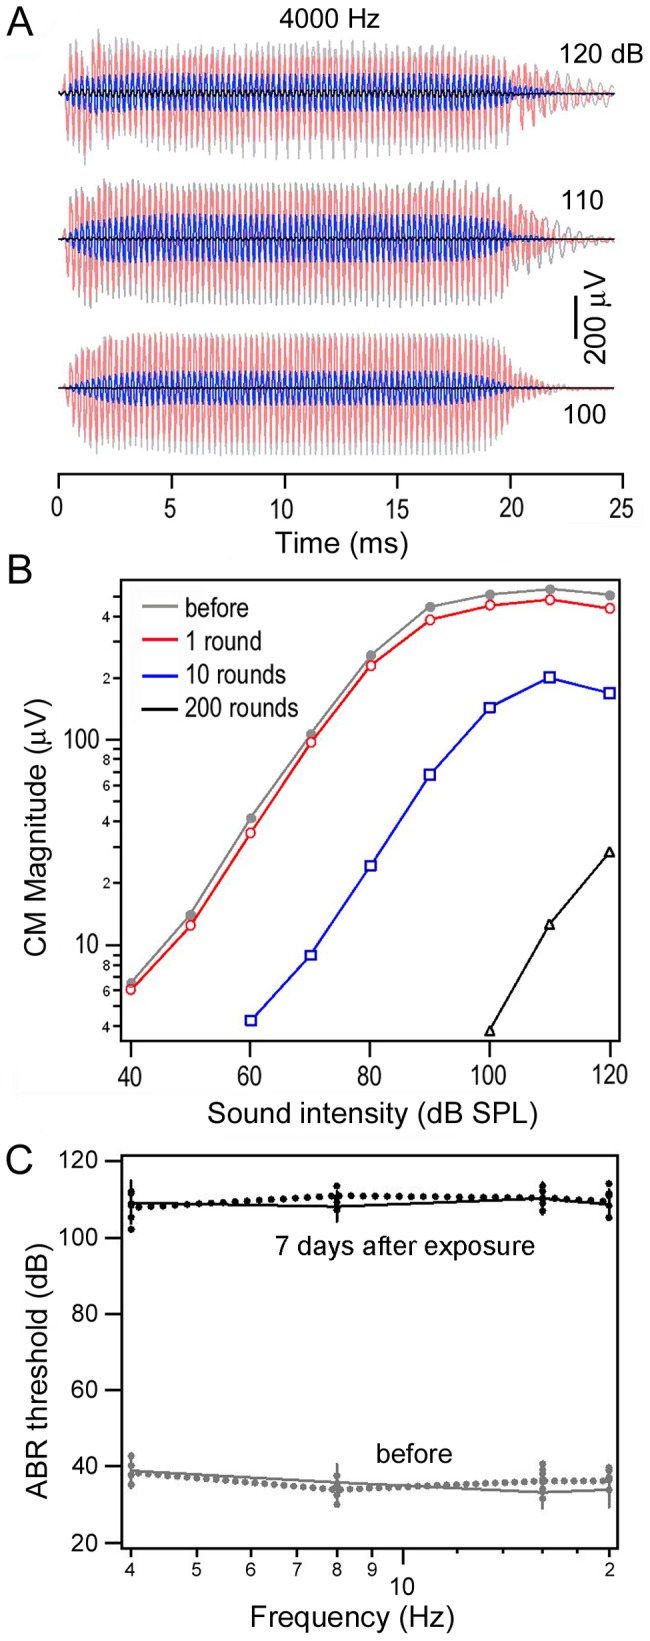
A: Three examples of CM responses obtained before, during, and immediately after noise exposure. B: CM magnitude as a function of sound level before, during, and after noise exposure. Note the magnitude is plotted on log scale. C: Tone pip-evoked ABR thresholds (mean ± SD, n = 19) for both ears before and seven days after noise exposure. No statistical difference (student's t-test) in thresholds at each frequency was found between left (dot lines) and right (solid lines) ears either before or after noise exposure (p>0.05).