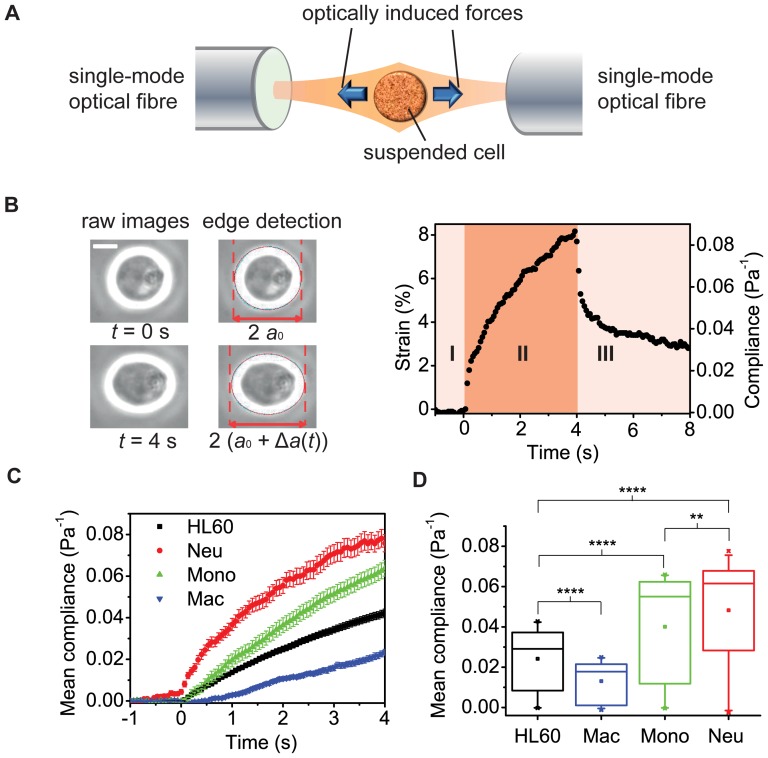
Figure 1. Creep compliance test distinguishes between cell lineages following differentiation.
A, Schematic of the optical stretcher (OS), showing two diverging, counter-propagating laser beams emanating from single-mode optical fibres. B, A cell is held at trapping stress of 1.7±0.1 Pa at time t = 0 s. The trapped cell is stretched when the optical stress is increased to 6.0±0.1 Pa, producing an axial strain of 8.17±0.05% at t = 4 s, for the cell shown. The graph shows both the strain and compliance profiles for this one cell, illustrating the single cell resolution of the OS method. Scale bar is 10 µm. C, Representative compliance profiles for all three fully differentiated lineages and for the undifferentiated cells (n = 89). For neutrophils (Neu; n = 75) and monocytes (Mono; n = 85), the compliance increased, while for macrophages (Mac; n = 52) the compliance decreased. D, Box plots of the average compliance during the four seconds of stretching. For all three differentiated lineages, the entire compliance profile, as well as the peak compliance at 4 s (not shown), were significantly different from undifferentiated HL60 cells, where **** and ** indicate significant differences with p values of <0.0001 and <0.01, respectively.

