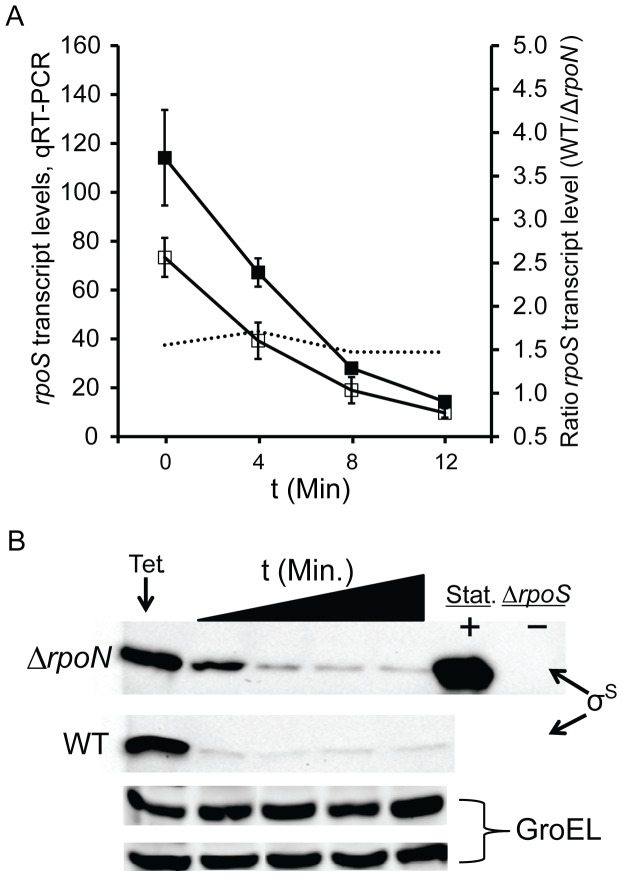
Figure 3. Stability of rpoS mRNA and σS.
(Panel A): Mean rpoS transcript levels (1st ordinate) and ratio of rpoS transcript (2nd ordinate) plotted against time following addition of rifampin at t = 0 min for WT TW14359 (filled) and TW14359ΔrpoN (empty); ratio is indicated by the dotted line. Error bars denote standard error of the mean (n≥3). (Panel B): Representative western immunoblot for σS as a function to time following addition of tetracycline at t = 0 min for TW14359 (WT) and TW14359ΔrpoN (ΔrpoN); blots are in increments of 4 min. Stationary phase (Stat.) protein extracts were used as a positive control for σS, and TW14359ΔrpoS (ΔrpoS) as a negative control. Equal loading was controlled for by westerns for GroEL (top row is ΔrpoN, bottom row is WT).

