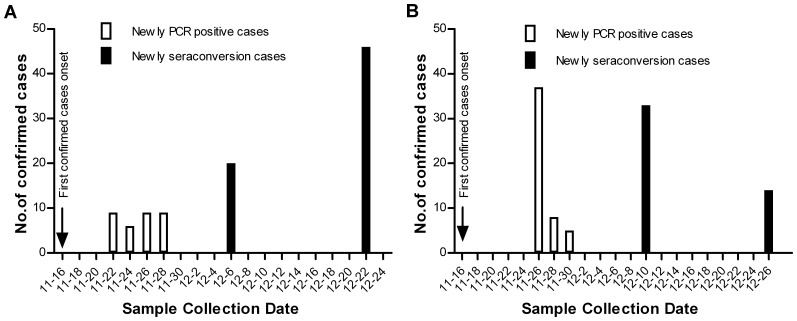
Figure 1. Number of newly confirmed cases by rRT-PCR or HI in the middle school and the primary school.
(A) The arrow indicates the date of onset of the first confirmed case in the middle school. The solid white bars represent the number of newly confirmed cases by rRT-PCR. The solid black bars represent the number of newly confirmed cases by HI. (B) The arrow indicates the date of onset of the first confirmed case in the primary school. The solid white bars represent the number of newly confirmed cases by rRT-PCR. The solid black bars represent the number of newly confirmed cases by HI.

