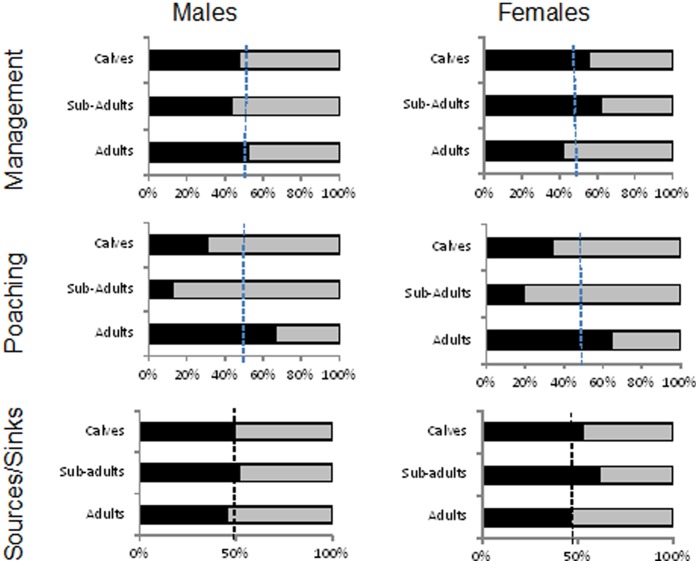
Figure 5. Age and sex proportions of white rhinos removed (solid bars) through management (top two graphs) during 2009 (ns = 215), 2010 (ns = 144) and 2011 (ns = 107) respectively, and poaching (bottom two graphs) during 2011 (ns = 133) in relation to age and sex proportions recorded for the population (grey bars) during 2009 (ns = 1477), 2010 (ns = 1110) and 2011 (ns = 1236) respectively.
We also present age and sex proportions of white rhinos in source areas (solid bars, n = 2315) and sink areas (grey bars, n = 2725) noted during 2009–2011. If the bars separate at the vertical broken line then the proportion removed equals the proportion available.

