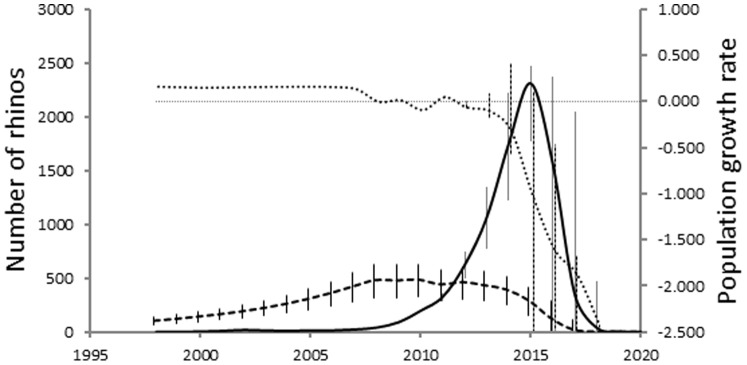
Figure 6. Number of rhinos predicted from the harvesting model for removal (broken line) and predictions for the likely number of rhinos poached (solid line), as well as the resultant instantaneous exponential population growth (stippled line).
The error bars represent 95% confidence intervals. The horizontal fine line is population growth of zero.

