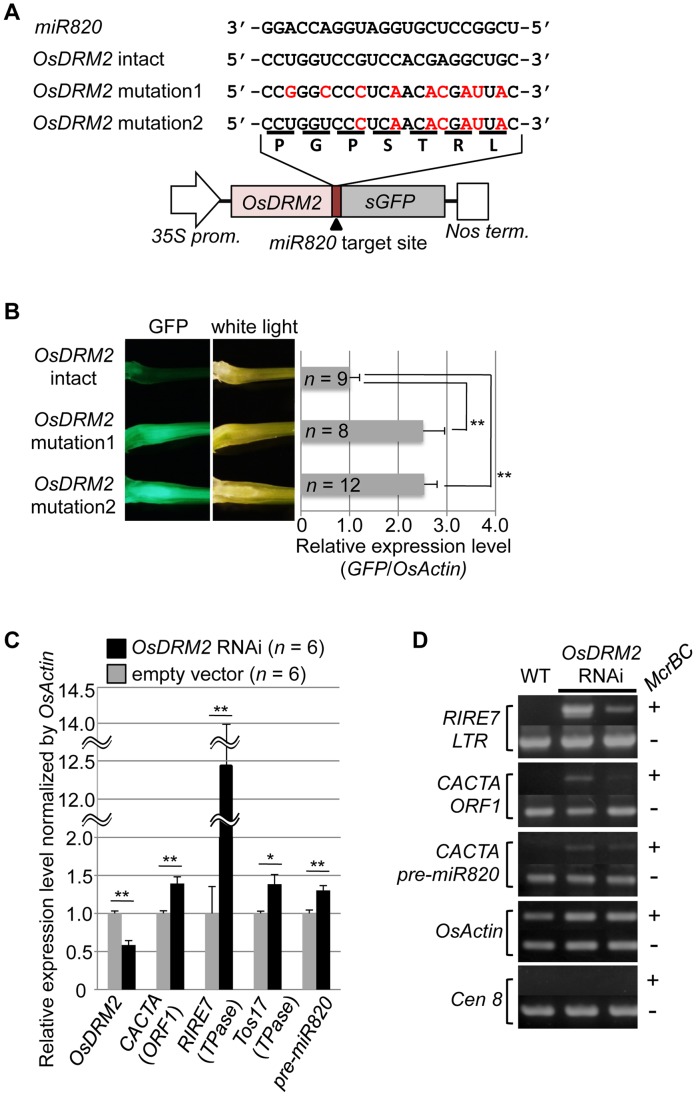
Figure 2. OsDRM2 is negatively regulated by miR820.
(A) The general structure of the OsDRM2::GFP fusion constructs is shown at the bottom, and the sequences of miR820a/b/c and the target sites in the 35S:OsDRM2 intact:GFP, 35S:OsDRM2 mutation1:GFP, and 35S:OsDRM2 mutation2:GFP constructs are shown at the top. The changed nucleotides in the mutant genes are shown in red letters. (B) The panels on the left show GFP fluorescence and white-light observations of longitudinal sections of shoots of transgenic plants transformed with the constructs in (A). The graph at the right shows relative expression levels of GFP mRNA in the corresponding transgenic lines as measured by quantitative RT-PCR. The expression level of OsDRM2-intact lines was set as 1. (C) Relative expression levels of OsDRM2 and TEs in OsDRM2 RNAi transgenic callus (black bars) measured by qRT-PCR. The expression level of empty-vector lines was set as 1. (D) McrBC-PCR analysis of genomic DNA from callus of WT and two independent transgenic lines of OsDRM2 RNAi. Two of the six OsDRM2 RNAi transgenic lines analyzed in (C) were used. In (B) and (C), values are means, with bars showing standard errors. Significance was assessed by a two-tailed Student's t-test; (**) significant at the 1% level; (*) significant at the 5% level. The n value represents the number of independent transformants.

