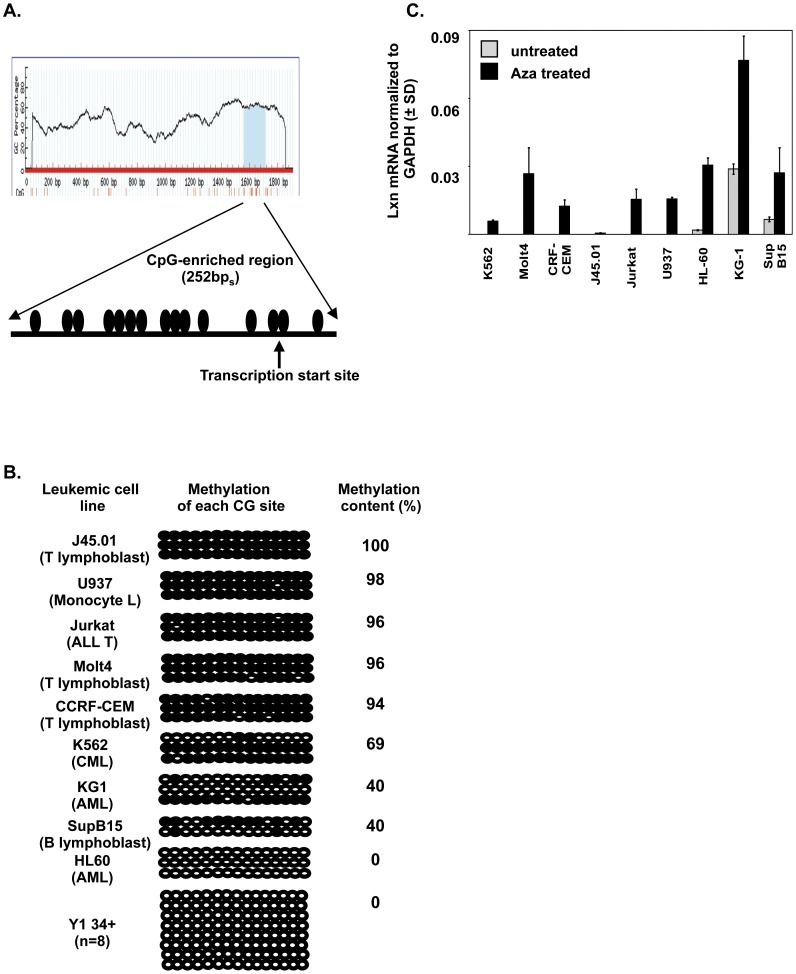
Figure 2. Hypermethylation of Lxn promoter CpG sites in leukemic cell lines.
(A) CpG-enriched region in Lxn promoter. Sequence from 1500 base pairs upstream regulatory region to the first three exons was analyzed for CpG-enriched sites (top). A CpG island with 252 base pairs (bps) length was identified. The transcription starting site is indicated. Each filled circle represents a CpG dinucleotide, and there are 15. (B) Bisulfite sequencing for Lxn promoter CpG island methylation analysis in leukemic cell lines. Files are each of the 15 CpGs and ranks are replicate clones sequenced for each CpG (n = 3). Open circles indicate unmethylated CpG (n = 3) dinucleotides. Filled circles indicate methylated CpG dinucleotides. The methylation content was quantified by dividing the number of methylated CpGs with total numbers of analyzed CpGs. (C) Restoration or up-regulation of Lxn expression by 5-aza-2′-deoxycytidine. Lxn mRNA was measured by quantitative real-time PCR in leukemic and lymphoma cell lines exposed with or without 2 uM 5-aza-2′-deoxycytidine for 4 days. Expression levels were normalized to endogenous control, Gapdh. Results shown are mean± SD of 12 replicates from 3 independent experiments.

