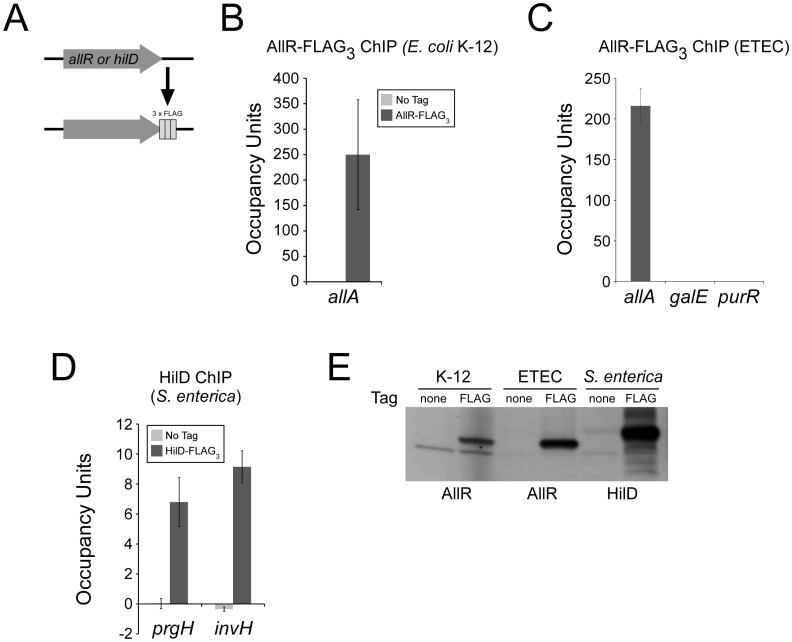
Figure 3. FRUIT epitope-tagging of MG1655 (E. coli K-12) allR, H10407 (ETEC) allR, and 14028s (S. enterica serovar Typhimurium) HilD.
(A) Schematic indicating C-terminal tagging with three FLAG tags. (B) ChIP/qPCR assay to measure association of MG1655 AllR-FLAG3 with the region upstream of allA (known AllR site in E. coli K-12) [32]. Values are also shown for a control ChIP with an untagged strain. Occupancy unit values represent background-subtracted enrichment relative to a control region. (C) ChIP/qPCR assay to measure association of H10407 AllR-FLAG3 with the region upstream of allA, or with predicted non-target regions upstream of galE and purR. Occupancy unit values represent background-subtracted enrichment relative to a control region. (D) ChIP/qPCR assay to measure association of 14028s HilD-FLAG3 with the regions upstream of prgH and invH (known HilD targets) [33]. Values are also shown for a control ChIP with an untagged strain. Occupancy unit values represent background-subtracted enrichment relative to a control region. (E) Western blot probing extracts from untagged and FLAG-tagged strains for MG1655 (K-12), H10407 (ETEC) and 14028s (S. enterica). Note that the anti-FLAG antibody cross-reacts with a protein expressed E. coli K-12.

