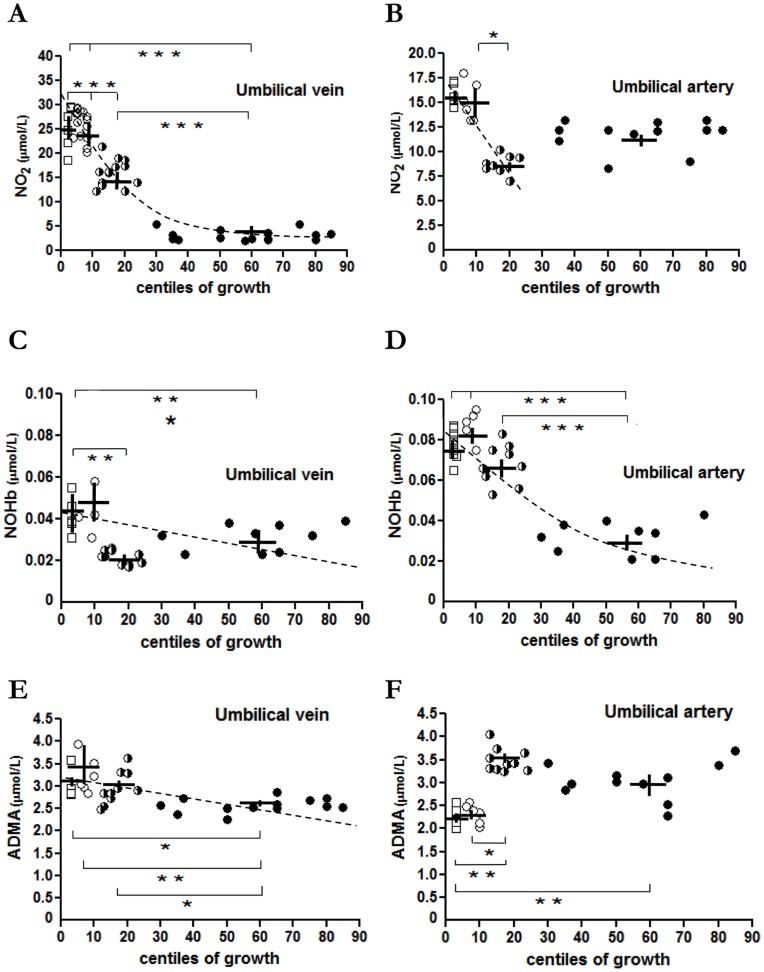
Figure 1. NO2, NOHb and ADMA levels in umbilical blood from pregnancies with normal or restricted fetal growth.
Umbilical vein and artery levels of NO2 (A, B), NOHb (C, D) and ADMA (E, F) at different BW centiles: 75th–25th (black circles); <25th–10th (black and white circles); <10th–3rd (white circles); <3rd (white squares). Dashed line presents the exponential or linear relationship between these variable and BW. *p<0.05; **p<0.01; ***p<0.001.

