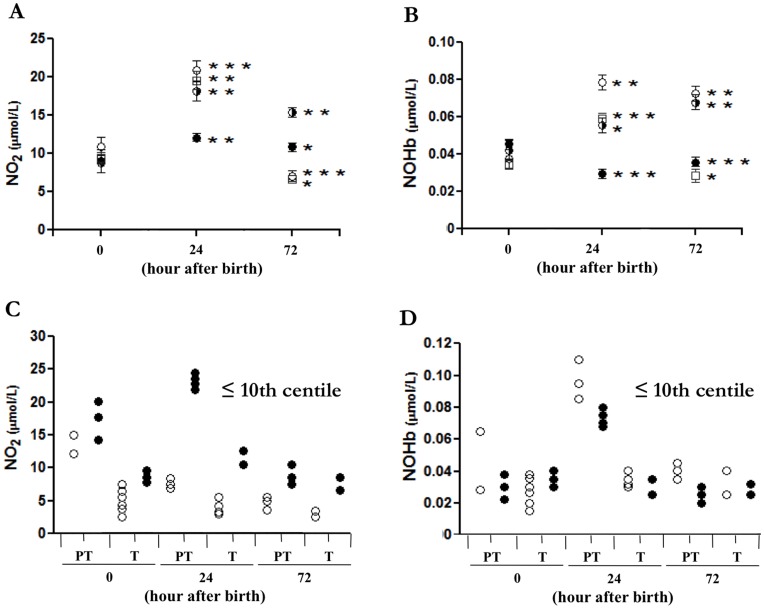
Figure 6. Time-related change in peripheral blood levels of NO2 and NOHb in AGA and SGA newborns.
Blood levels of NO2 (A, C) and NOHb (B, D) in relation to BW centile (A, B) and prenatal Doppler finding (C, D) at different time intervals after birth. BW centile: 75th–25th (black circles); <25th–10th (black and white circles); <10th–3rd (white circles); <3rd (white squares). Doppler finding for term (T) and preterm (PT) pregnancy: normal (white circles) and abnormal (black circles) with each point representing a single patient. *p<0.05; **p<0.01; ***p<0.001 for 24- and 72- h intervals relative to time zero. Note that, in the aggregate, NO2 and NOHb values for 75th–25th centile are significantly different from the other groups (p<0.001) at the 24- and 72-h time intervals, the only exception being the NOHb value for the <3rd centile at the 72-h mark (p = 0.068).

