
Figure 3. Schematic representation of a two-dimensional interaction plot.
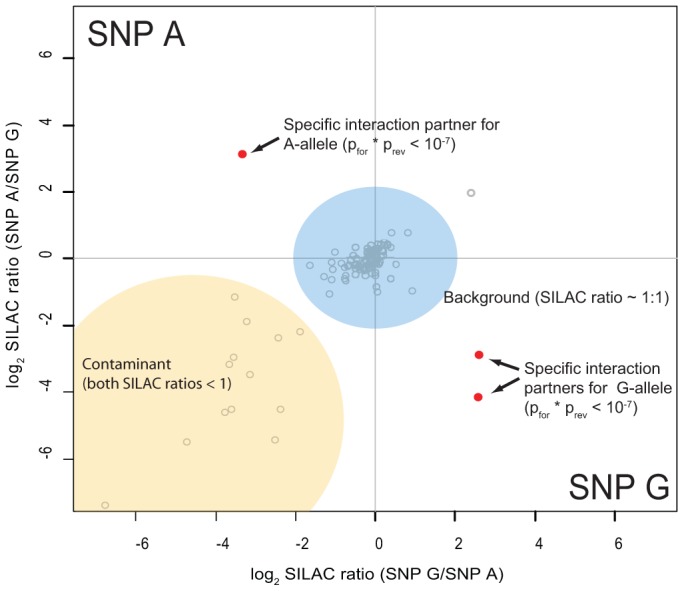
While specific outliers are found in the upper left (variant A) or the lower right (variant G) quadrant, most proteins cluster around the origin as they are binding to both variants equally. Contaminants have a SILAC ratios lower than 1 even when labels are switched and thus are grouped in the lower left quadrant.