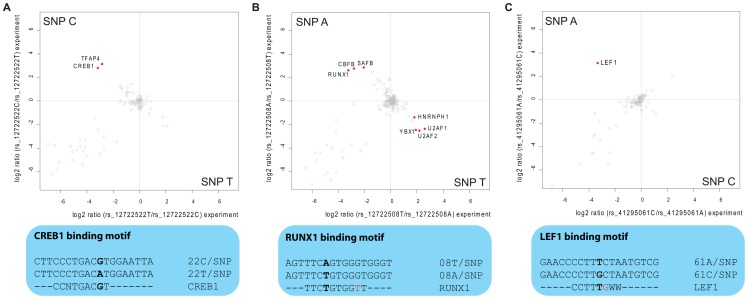
Figure 4. Interaction analysis for fine-mapped T1D SNPs.
Two-dimensional interaction plots reveal the specific binding of transcription factors. A: CREB1 and TFAP4 are enriched on rs12722522*C while this allele resembles a perfect match to the CREB consensus binding motif. B: rs12722508 is bound by several transcription factors (upper panel) among them the RUNX1-CBFB heterodimer, although the sequence around rs12722508*A does not match perfectly the transcription factor consensus motif (lower panel); C: Quantitative SNP pull-down screen identifies LEF1 to bind around 8 times stronger to rs41295061*A.

