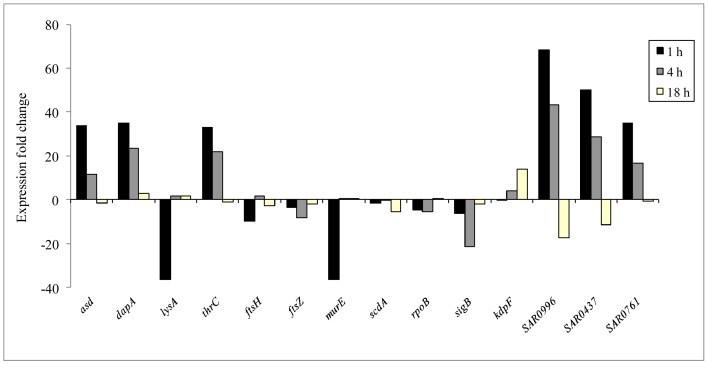
Figure 2. Schematic representation of the diaminopimelate (DAP) pathway in staphylococci.
The pathway depicts expression of DAP biosynthesis related genes induced or reduced in rhodomyrtone-treated MRSA after 1 h incubation. Gray boxes: genes that were significantly represented by microarray; pink boxes: genes that were significantly represented by qRT-PCR. Blue arrow and red arrow represented an increase or decrease in expression fold change, respectively.

