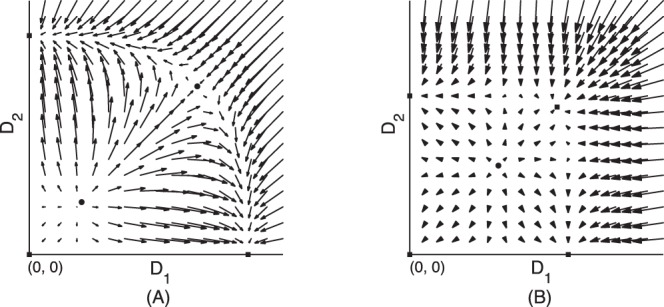
Figure 2. Illustration of adaptation in the phase plane.

Squares denote the stable equilibrium states. Arrows starting at point  stand for the rate of change of the two diameters. (A) phase plane of a parallel vessel system. In the three stable equilibrium states, at least one diameter is zero, i.e., at most one vessel can survive. (B) phase plane of a parallel system with switches (fixed OTRs). There is a new stable equilibrium in which neither diameter vanishes, i.e., both vessels survive.
