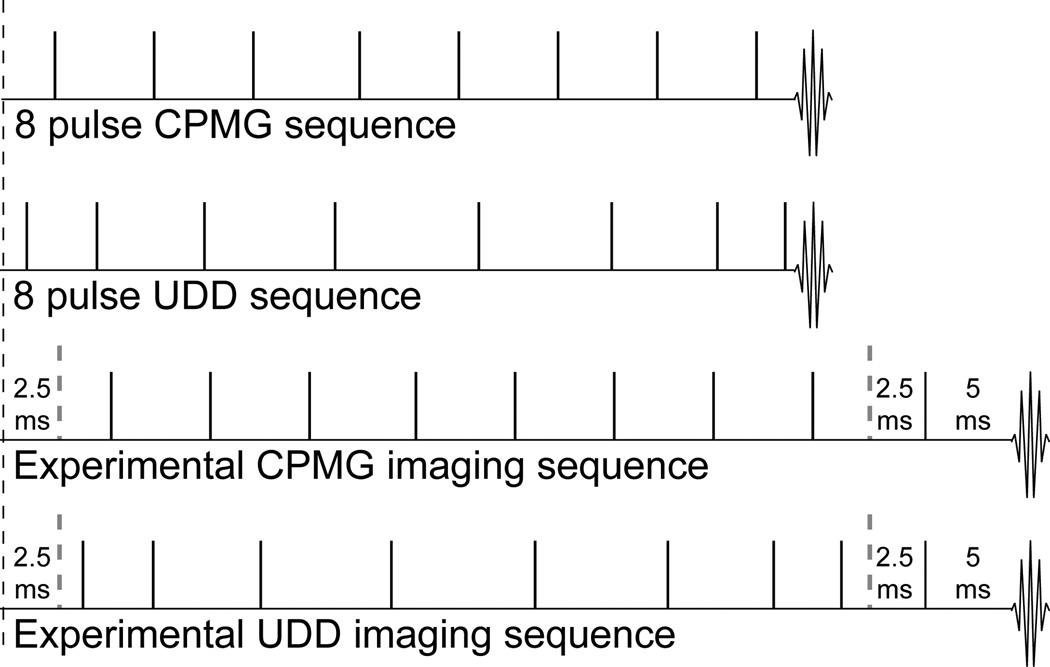
Figure 1.
8 pulse CPMG (top) and UDD (upper middle) sequences. All pulses shown are π pulses, while the location of the π/2 excitation pulse in each sequence is indicated by the black dotted line. The CPMG sequence has equally spaced pulses, while the UDD sequence has shorter delays at the beginning and end and longer delays in the middle. The lower middle and bottom sequences show the timing for the experimental imaging sequences, where a spin echo sequence (TE = 10 ms) is added after the CPMG and UDD sequences to provide slice selection.

