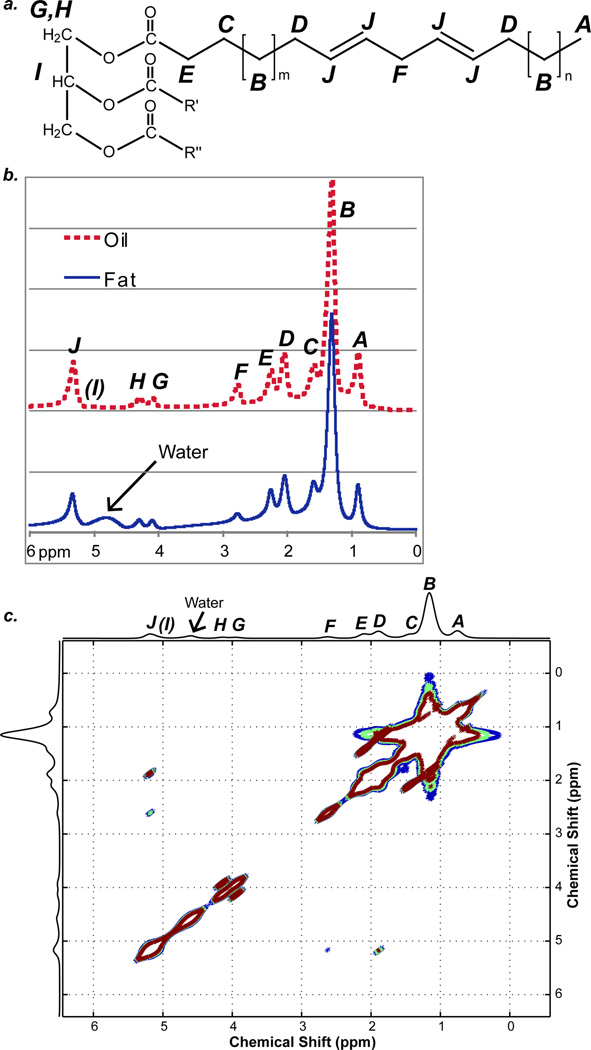
Figure 2.
a: The chemical structure of a typical fat molecule. b: 1H NMR spectra of excised mouse fat (bottom trace) and vegetable oil (upper trace). Nine resonances can be resolved (A – J, excluding I, as labeled in Figure 2a), and water signal is present in the mouse fat spectrum. c: COSY spectrum of excised mouse fat. J-couplings are present between spins A and B; B and C; B and D; C and E; D and J; F and J; G and H; G and I; and H and I.

