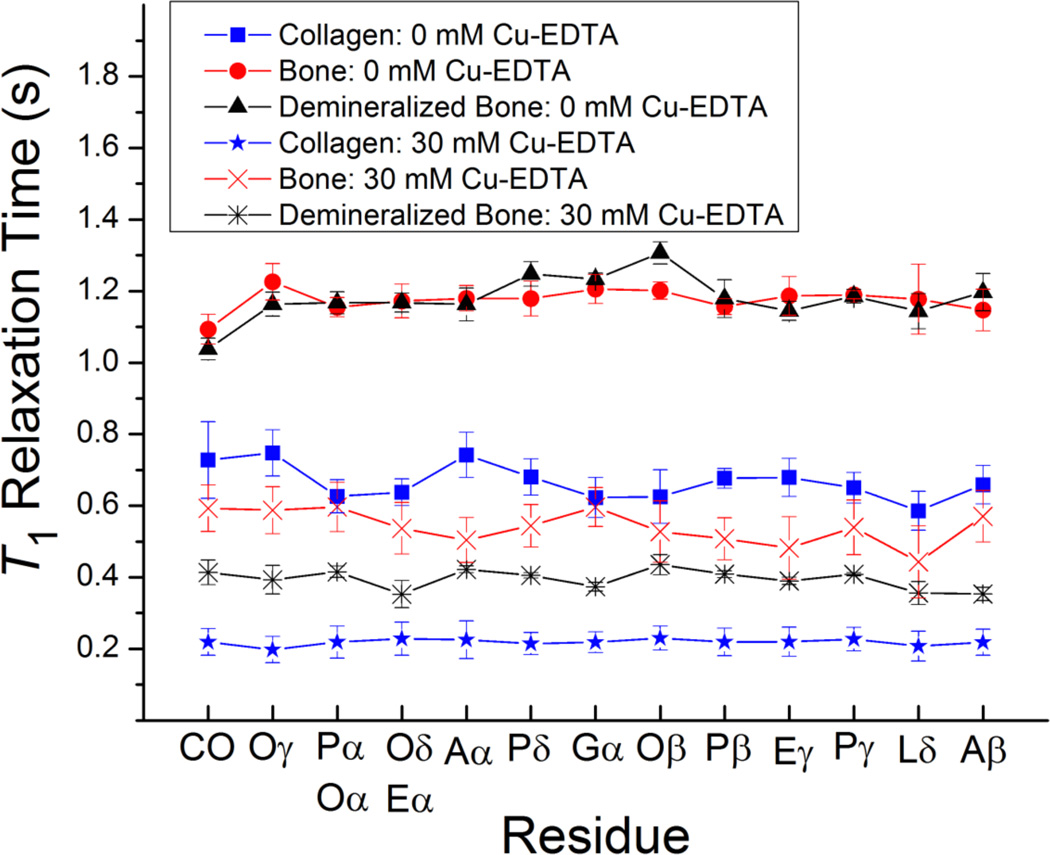
Figure 3.
Spin-lattice (T1) 1H relaxation times for the various residues in collagen, powdered cortical bone, and demineralized bone in the absence and in the presence of Cu–EDTA (30 mM). The T1 values were determined from 1H-spin-inversion recovery experiments detected in 13C Ramp-CP MAS, and the reported errors were estimated from the best-fitting of experimental data. All measurements were performed on a 900 MHz Bruker AVANCE solid-state NMR spectrometer. Other experimental and data processing details are mentioned in Figure 1 caption. A, alanine; L, leucine; P, proline; E, glutamic acid; O, hydroxyproline; G, glycine; CO, carbonyl. The signals from (Pα, Oα) and (Oδ, Eα) overlap in the 13C NMR spectrum.

