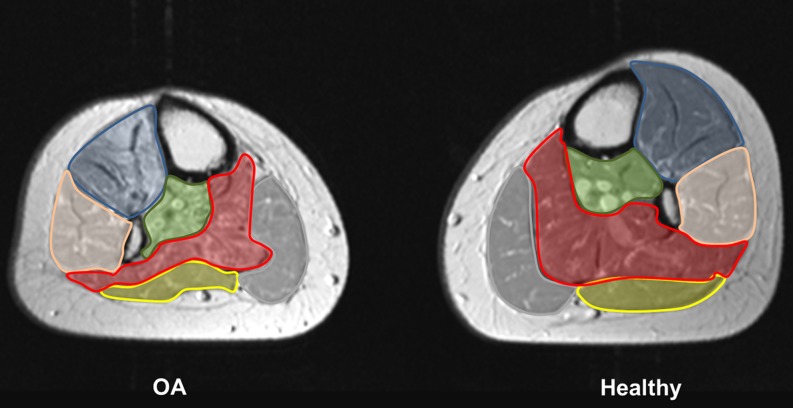
Fig. 1.
Quantitative analysis. This figure represents the affected and healthy lower leg of patient no. 1 from Table 1. To calculate the area, the anatomic boundary of following muscle groups (respectively the individual muscles) were manually marked: the anterior tibial muscle group (blue), the peroneal muscle group (pink), the deep dorsal muscle group (green), the M. gastrocnemius medialis (grey) and lateralis (yellow), and the M. soleus (red)

