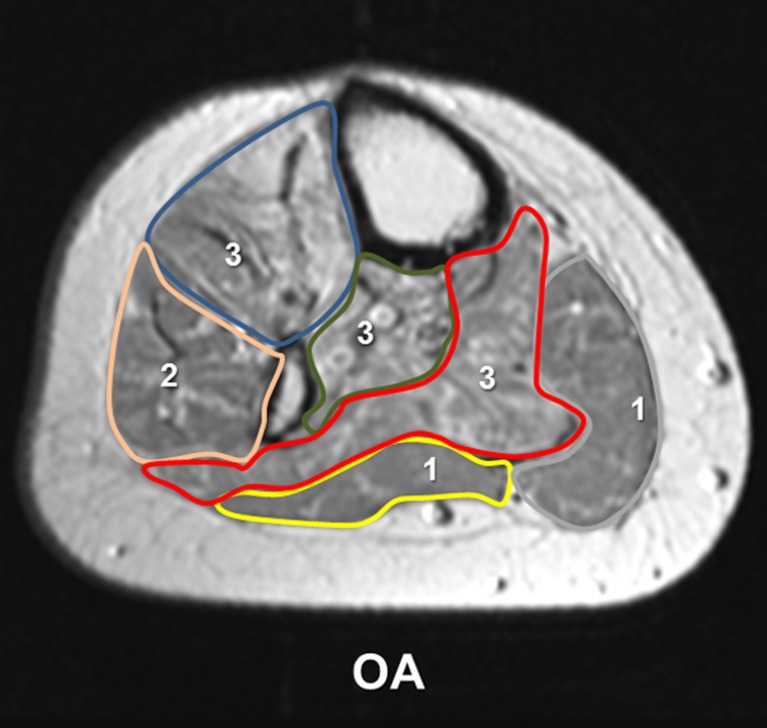
Fig. 2.
Qualitative analysis. This figure represents the affected lower leg of patient no. 1 from Table 1. Fatty muscle degeneration was assessed at the level of the quantitative measurement. The grade of fatty degeneration is displayed within each muscle group: anterior tibial muscle group (blue, 3), the peroneal muscle group (pink, 2), the deep dorsal muscle group (green, 3), the M. gastrocnemius medialis (grey, 1) and lateralis (yellow, 1), and the M. soleus (red, 3)

