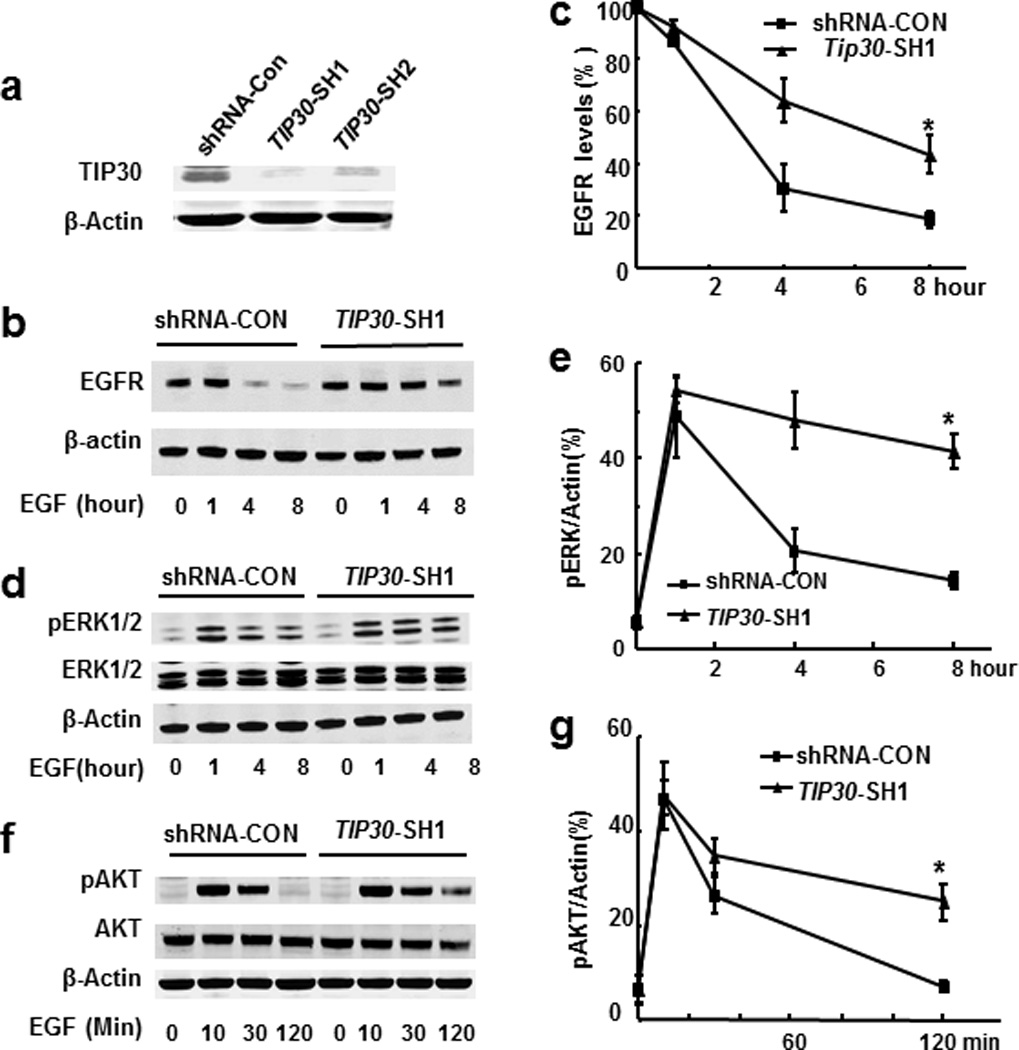
Figure 4.

Effects of TIP30 deficiency on EGFR degradation and signaling in human A549 cells. (a) Western blot analysis of A549 cells with shRNA-control or TIP30 knockdown. Whole cell lysates were made from cells expressing a scramble shRNA-CON, TIP30-SH1 or TIP30-SH2 that specifically target TIP30. (b–g) Western blot analysis of EGFR (b, c), pERK1/2 (d, e) and pAKT (f, g) in extracts of shRNA-CON and TIP30-SH1 knockdown A549 cells. Cells were treated with EGF, then incubated in DMEM including cycloheximide and collected at various time points after EGF treatment and subjected to Western blot analysis with indicated antibodies. The amount of EGFR in each lane was quantified and normalized to the amount of β-actin. The values are expressed as percent of EGFR at time zero (c) pAKT or pERK1/2 levels were expressed as the percentages of β-actin. Results are representative of three independent experiments. * P < 0.05 versus shRNA control.
