Figure 1.
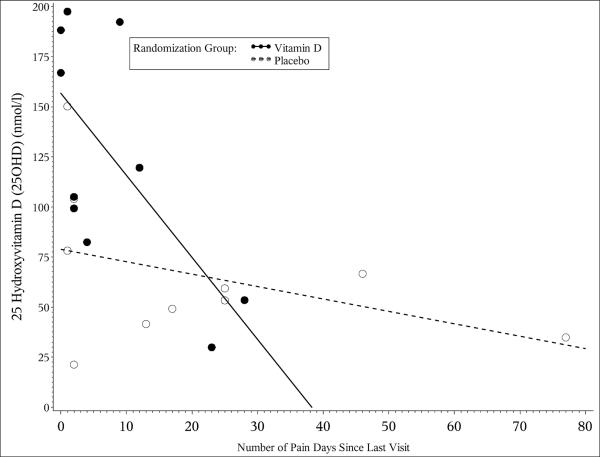
[a]: The scatter plot depicts the relationship between serum 25OHD concentrations (nmol/l) with the number of pain days for the vitamin D group (dark circles, bold line) and placebo group (open circles, dotted line) at week 8. The slope of the regression lines representing the strength of the relationship between 25OHD and number of pain days varied at each time point in the study. Serum 25OHD concentrations correlated negatively with the number of pain days at week 8 (r = −0.680 95% CI [−0.903, −0.102], p=0.019) for vitamin D group compared to the placebo group (r = −0.403 95% CI [−0.816, −0.324], p=0.258)
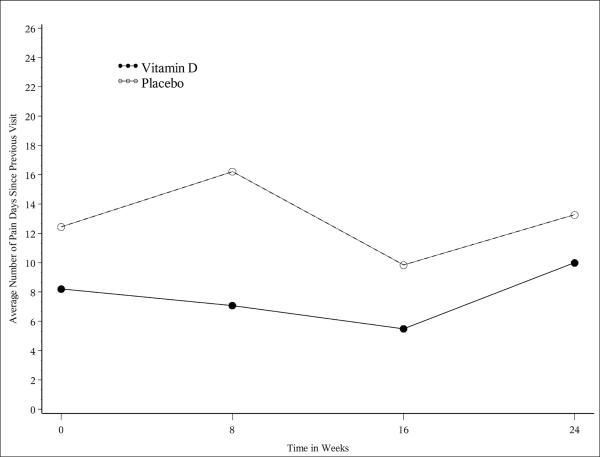
[b]: There was a distinct trend towards fewer pain days between visits over the first 16 weeks of the study in the vitamin D group. Although this change did not reach statistical significance due to the small sample size, it is in contrast to the sporadic fluctuation in the number of pain days seen in the placebo group over the same time period.


