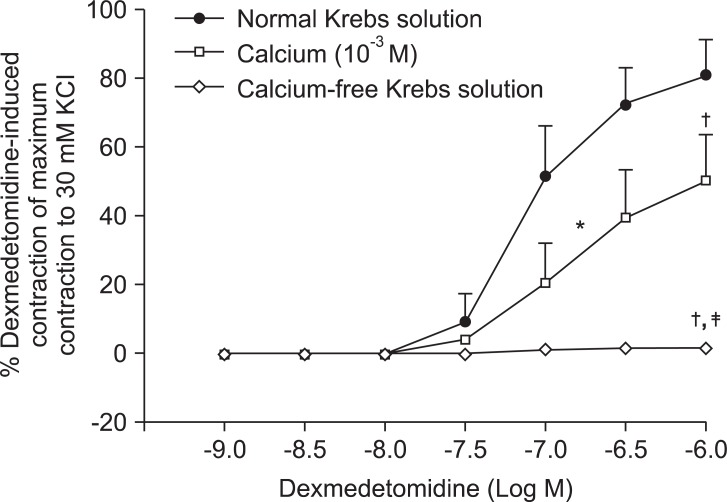
Fig. 4.
Effects of low calcium concentration (10-3 M) and calcium-free Krebs solution on dexmedetomidine-induced concentration-response curves in endothelium-denuded aorta. Data are shown as the mean ± SD and expressed as the percentage of the maximum contraction induced by isotonic 30 mM KCl. ED50: *P < 0.001 versus normal Krebs solution. Maximal contraction: †P < 0.001 versus normal Krebs solution; ‡P < 0.001 versus 10-3 M calcium.

