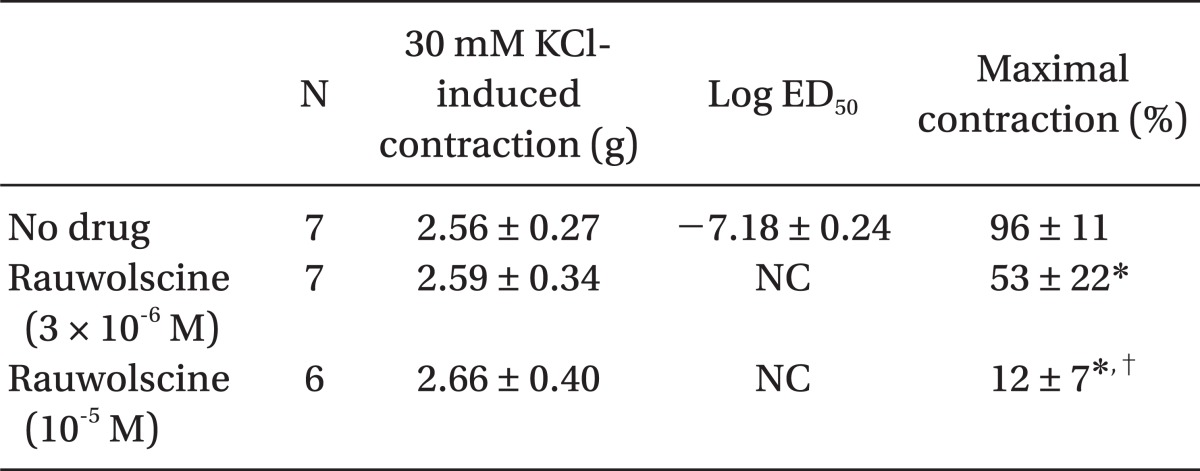
Table 1.
Effects of Rauwolscine on Dexmedetomidine-induced Concentration-response Curves in Isolated Endothelium-denuded Rat Aorta
Values are the mean ± SD. N indicates the number of descending thoracic aortic rings. NC: Not calculated because data were not fitted into a sigmoidal dose-response curve for calculation of the ED50. *P < 0.001 versus no drug, †P < 0.001 versus 3 × 10⁻⁶ M rauwolscine.

