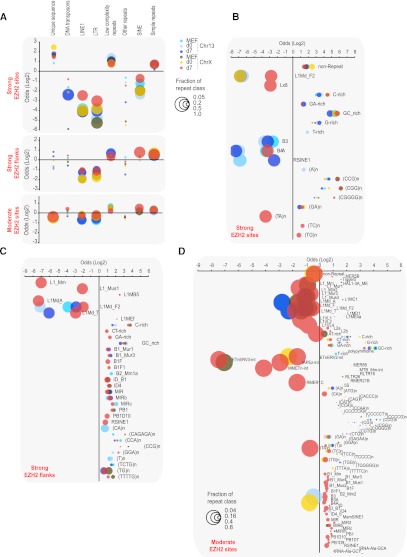
Figure 4.
Relationship of repetitive elements to EZH2 sites. (A) Repeat classes enriched or depleted in strong sites, ±3 kb flanking strong sites, and moderate sites are plotted by their level of enrichment (positive log2 odds ratio) or depletion (negative). Different time points and chromosomes, as marked. Bubble sizes indicate the fraction of sites (scale: 0.05, 0.2, 0.5, 1.0) containing a given repeat class (if enriched) or lacking it (if depleted). For example, LINE1 sequences are depleted across the board in most sites, hence their bubbles are large. Only statistically significant (Z > 2.5) enrichment or depletion is shown (bubble sizes smaller than 0.05 indicate insignificance). The full data are listed in Supplemental Table S2 for further reference. (B–D) Log2 odds ratios for significant (Z > 2.5) enrichment and depletion of specific repeat types at strong sites (B), flanking (±3 kb) strong sites (C), and moderate sites (D). The full data are listed in Supplemental Table S3 for further reference.

