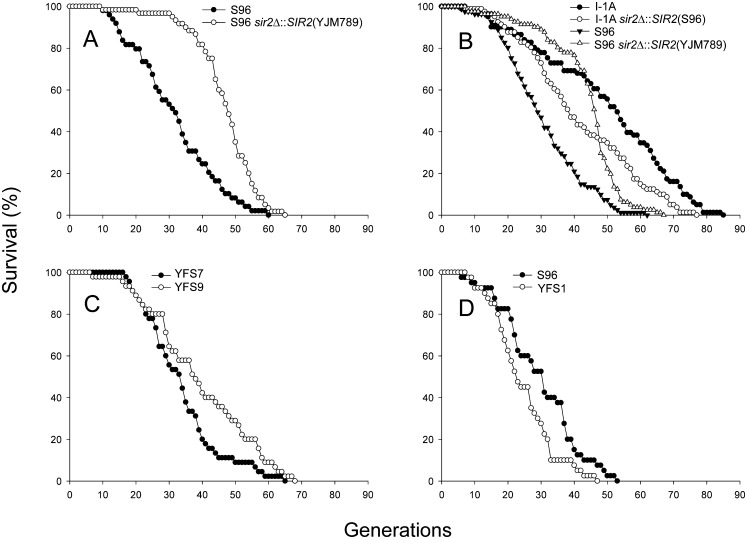
Figure 3.
Cumulative survival curves. (A) The RLSs of 49 cells of strain S96 and 60 cells of strain S96 sir2Δ∷SIR2(YJM789) were determined. The mRLS of S96 was 31.7 generations, and for S96 sir2Δ∷SIR2(YJM789) it was 46.9 generations. The difference in RLS was significant (P < 5 × 10⁻⁶). (B) The RLS of 81 cells each was determined. For line I-1A, the mRLS was 49.5 generations; for strain I-1A sir2Δ∷SIR2(S96), it was 41.6. The difference in RLS was significant (P = 0.0079). For S96, the mRLS was 30.7 generations, and for S96 sir2Δ∷SIR2(YJM789) it was 43.7 generations. The difference in RLS was significant (P < 5 × 10⁻⁶). I-1A is the recombinant line with the longest RLS. (C) The RLS of 45 cells each was determined. For strain YFS7 (YJM789 background with RDN1 from YJM789) the mRLS was 33.8 generations, and for strain YFS9 (YJM789 background with RDN1 from S96) it was 40.0 generations. The difference in RLS was significant (P = 0.030). (D) The RLS of 40 cells each was determined. For strain S96, the mRLS was 29.8 generations, and for strain YFS1 (S96 background with RDN1 from YJM789) it was 24.6 generations. The difference in RLS was significant (P = 0.032). The x-axis shows the RLS in generations and the y-axis shows the percentage of surviving cells.

