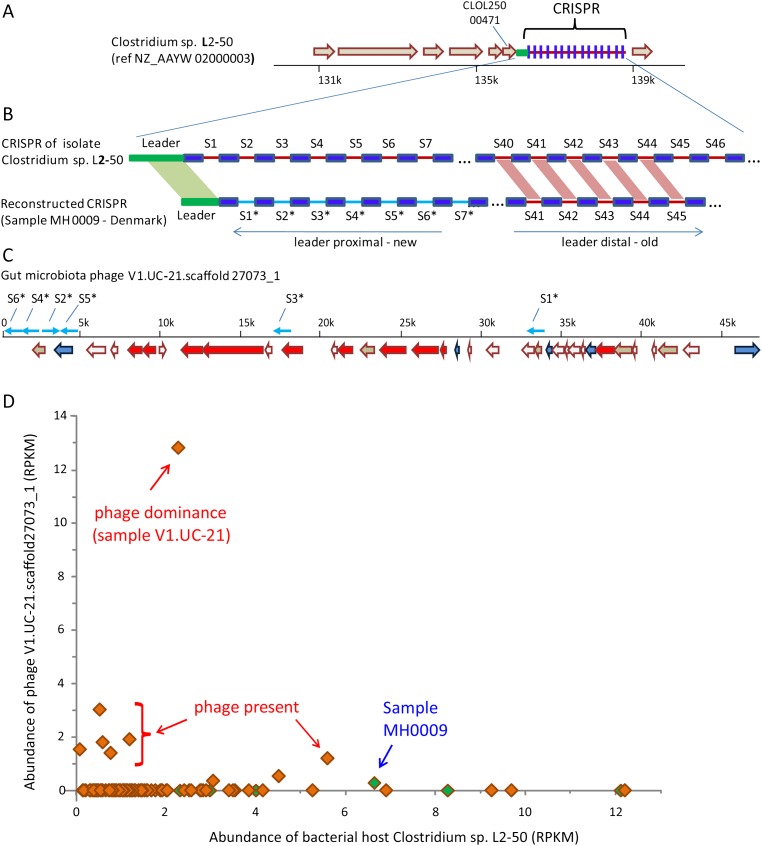
Figure 3.
Phage/host infection and resistance interactions. (A) The CRISPR region in the isolate gut bacterium Clostridium sp. L2-50, which was sequenced as part of the Human Microbiome Project (HMP) (Turnbaugh et al. 2007). Shown is a 10-kb region from the draft assembled genome. (Block arrows) Annotated genes. (B) A CRISPR array reconstructed from metagenomic sequence reads of sample MH0009 partially matches the Clostridium sp. L2-50 array. (Dark blue boxes) CRISPR repeats; (red and cyan lines) spacers. Spacers are numbered according to their position in the array relative to the leader sequence. Spacers show identity in sequence and in order at the leader-distal region (“old” spacers), while leader-proximal spacers (newly acquired) differ between the arrays. (C) Contig V1.UC-21.scaffold27073_1 was identified as a phage in this study, because it is hit by multiple spacers. (Block arrows) Genes with colors denoting function; (red) phage-specific genes; (blue) DNA replication genes; (white) genes of unknown function; (brown) genes of other functions. (Cyan arrows) Positions where spacers from the reconstructed array in panel B show identity with the phage sequence (spacer hits not drawn to scale). All drawn spacers fully match or have one mismatch with the phage sequence. (D) Abundance of bacterial host versus phage in MetaHIT samples. X- and y-axes represent abundance of the bacterial host and phage, respectively, measured in RPKM. Each data point represents a European individual sampled as part of the MetaHIT gut microbiota project (Qin et al. 2010). Green-filled samples are those in which our analysis found a spacer that matched the phage sequence. Sample MH0009, in which the CRISPR array in panel B was reconstructed, is identified.

