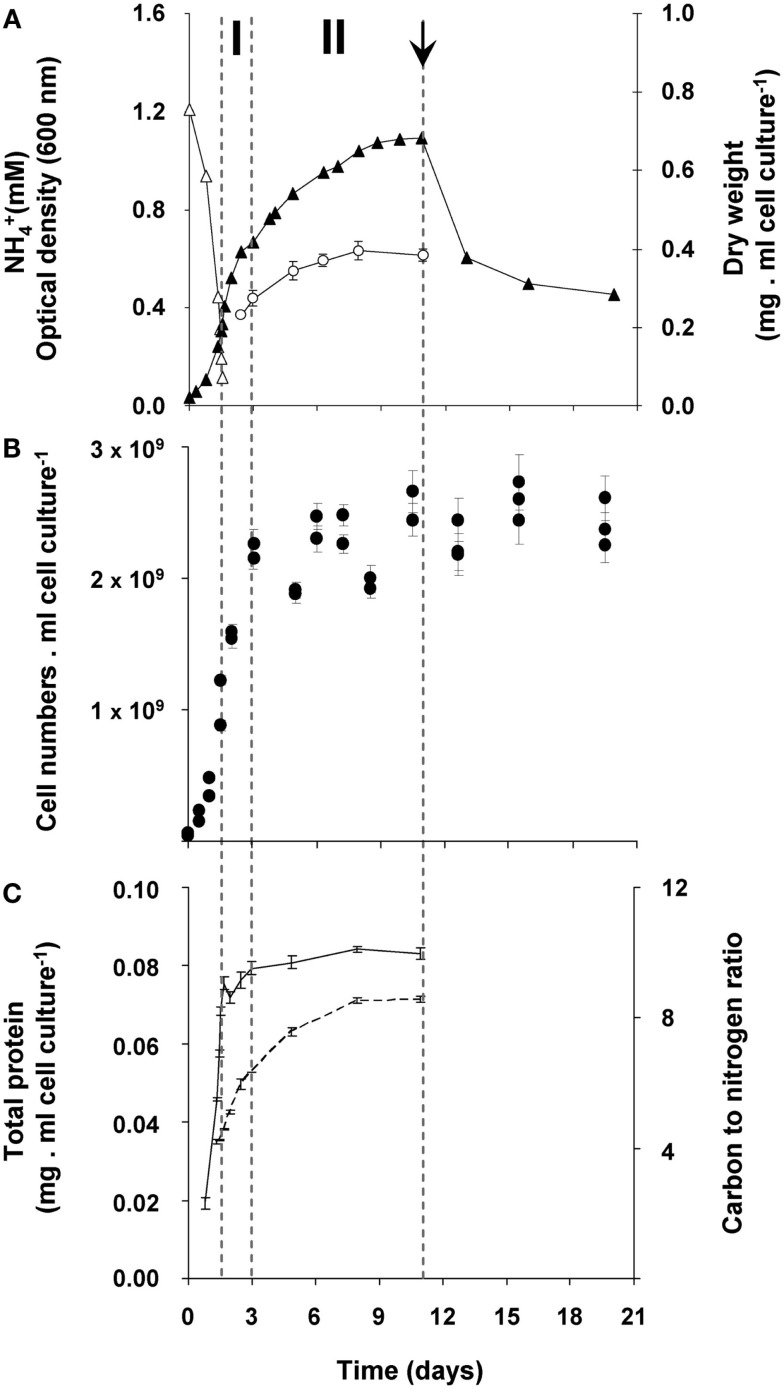
Figure 1.
Growth response of “Ca. M. fumariolicum” SolV upon ammonium depletion. (A) Growth was monitored by measuring increase in optical density (closed triangles) and dry weight (open circles). Error bars represent SEM (n = 4). Concentration of ammonium is represented by open triangles. After 1.5 days of exponential growth (μmax = 0.07 h−1) ammonium was depleted and two phases were observed, indicated by dashed lines and the symbols I and II. At day 11 (arrow), cell cultures were diluted into ammonium containing medium, but without methane added. To compare with the original optical density and cell numbers, values were multiplied by the dilution factor. (B) Cell numbers per ml cell culture of “Ca. M. fumariolicum” SolV (solid circles). Error bars represent SEM (n = 30). (C) Total protein (solid line), determined in the crude extracts prepared from harvested cells and carbon to nitrogen ratio of the harvested cells (dashed line). Error bars represent SEM (n = 4–5).

