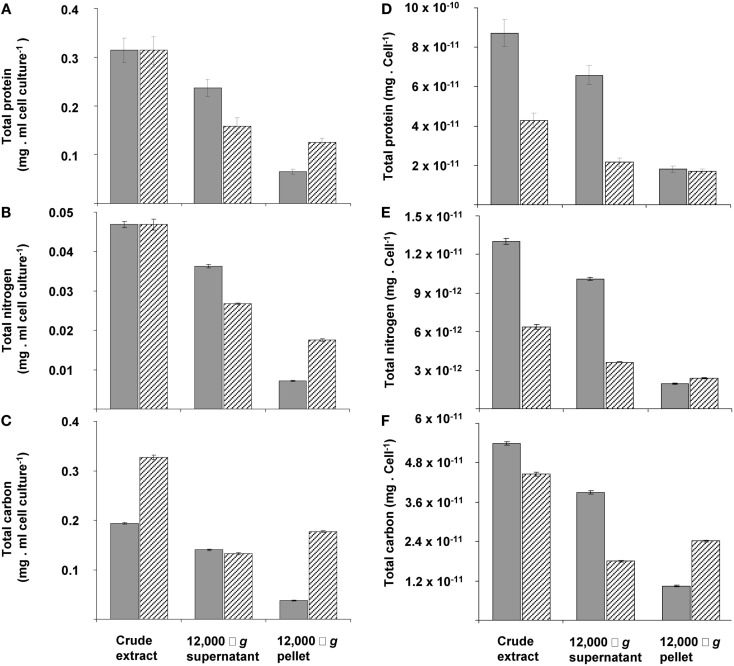
Figure 3.
The distribution calculated per ml of cell culture (A,B,C) or per cell of total protein (D,E,F) of total protein (A,D), nitrogen (B,E), and carbon (C,F) over pellet and cytosol fractions at the beginning (gray bars) and end (dashed bars) of transition phase I in the crude extract, 12,000 × g supernatant and 12,000 × g pellet. This experiment was performed with exponentially growing cells that had reached an optical density of 0.5 (see Figure 2A).The amount of total protein and total nitrogen in this exponentially growing cells were normalized to values from cells obtained at the start of transition phase I, since total protein (see Figure 1C) and total nitrogen (see Figure 2B) stabilized after ammonium depletion. The total carbon of the exponentially growing cells was normalized to values from cells obtained at the end of the exponential growth phase (at optical density of 1.12). Error bars represent SEM (n = 4).

