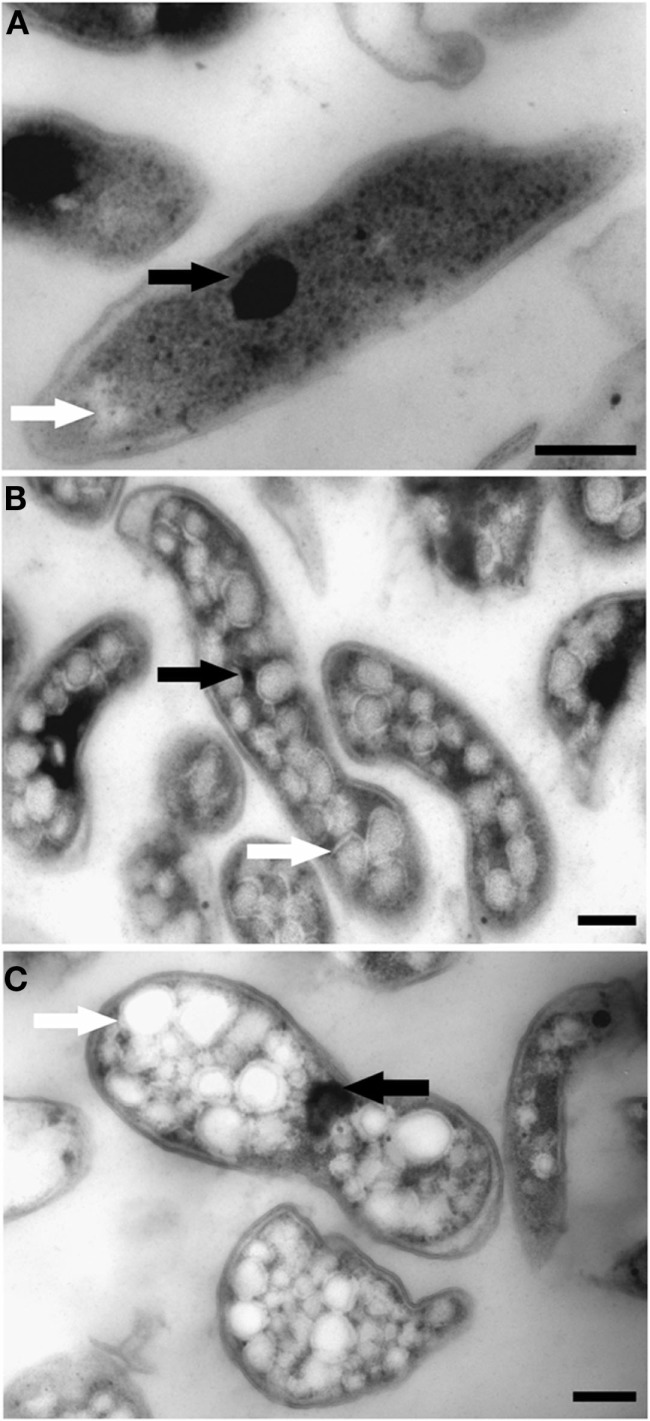
Figure 5.
Transmission electron micrographs showing chemically fixed, Epon-embedded thin sections of “Ca. M. fumariolicum” cells in different growth phases. (A) Cell from the exponential phase. (B) Cells taken at the end of transition phase I. (C) Cells taken at the end of transition phase II. Electron light (white arrows) particles are seen in all growth phases, but are especially abundant in cells of transition phase I and II. Electron dense particles (black arrows) are present in all growth phases. Scale bars, 200 nm.

