
Figure 3.
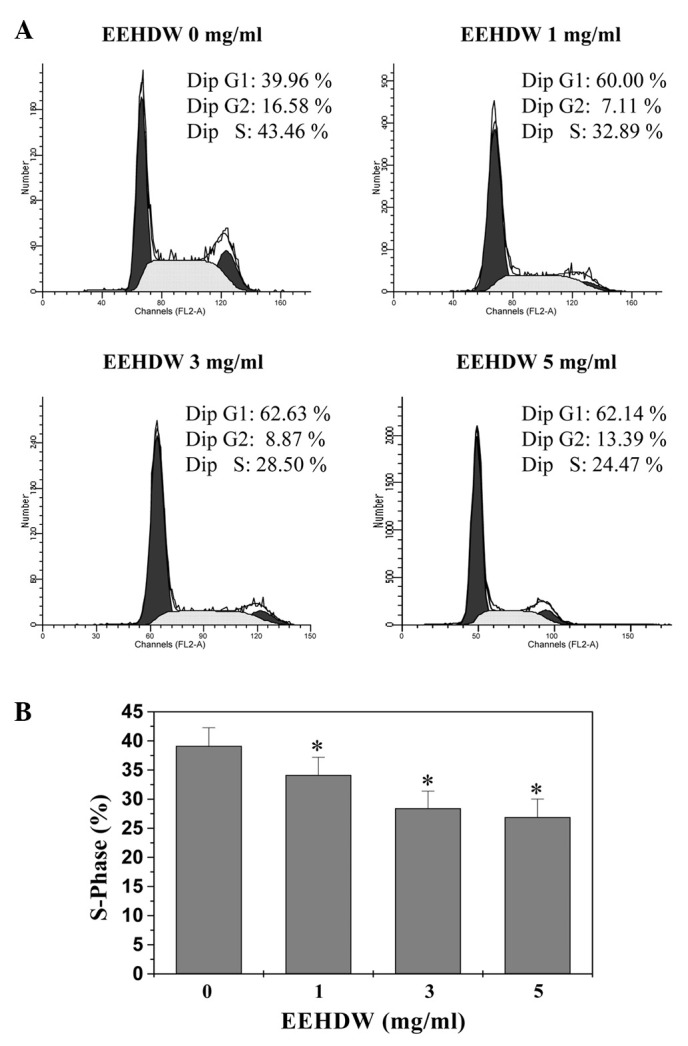
Effect of EEHDW on the cell cycle progression of HT-29 cells. (A) Cells were treated with indicated concentrations of EEHDW for 24 h, stained with PI and analyzed by FACS. Images are representative of three independent experiments. (B) The proportion of DNA in S phase was calculated using ModfitLT Version 3.0 Software. Data shown are averages with SD (standard deviation; error bars) from three independent experiments. *P<0.05, versus control cells. FACS, fluorescence-activated cell sorting; EEHDW, ethanol extract of Hedyotis diffusa Willd; PI, propidium iodide.