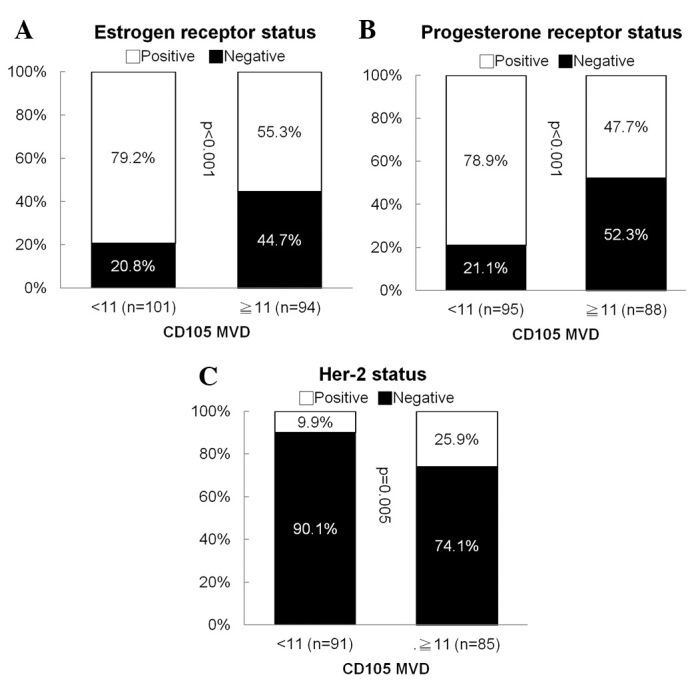
Figure 2.

Correlation analysis between pathological variables and CD105. CD105 correlated (A) inversely with estrogen receptor expression (p<0.001), (B) inversely with progesterone receptor expression (p<0.001) and (C) positively with Her-2 expression (p=0.005). MVD, microvascular density.
