
Figure 7.
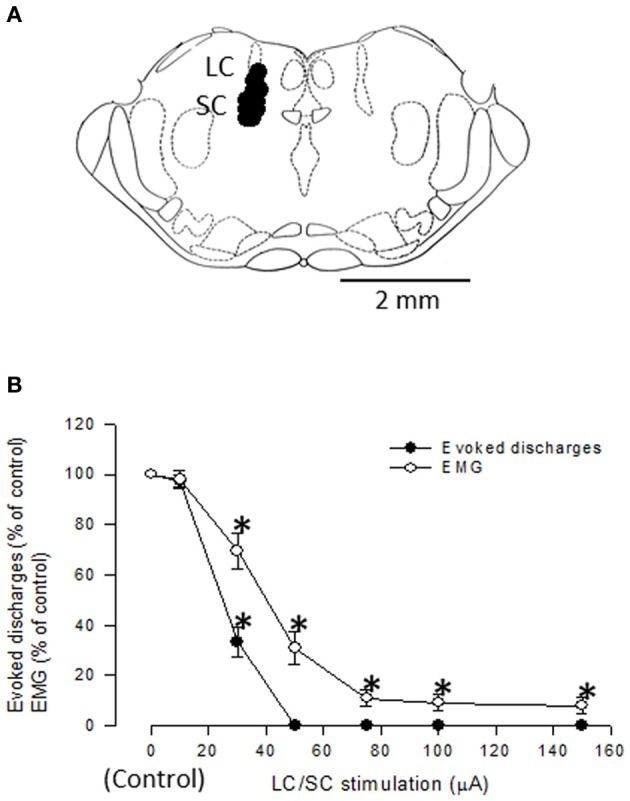
(A) Localization of LC/SC stimulation sites (n = 12). Each closed circle represents one animal. The rostrocaudal extension of the stimulation sites was 9.6 ± 0.1 mm caudal to the bregma. Only data from rats in which the tip of the stimulating electrode was located within the LC/SC were adopted. (B) Graphs summarizing the effects of varying stimulus intensities of LC/SC stimulation on either the evoked discharge or the EMG activity (n = 8). The evoked discharge and the EMG activity during LC/SC stimulation are expressed as a percentage of the value before LC/SC stimulation (control). Note that the inhibitory effect was different between the evoked discharge and the EMG. *P < 0.05, significantly different from the control. (Tsuruoka et al., 2010b).