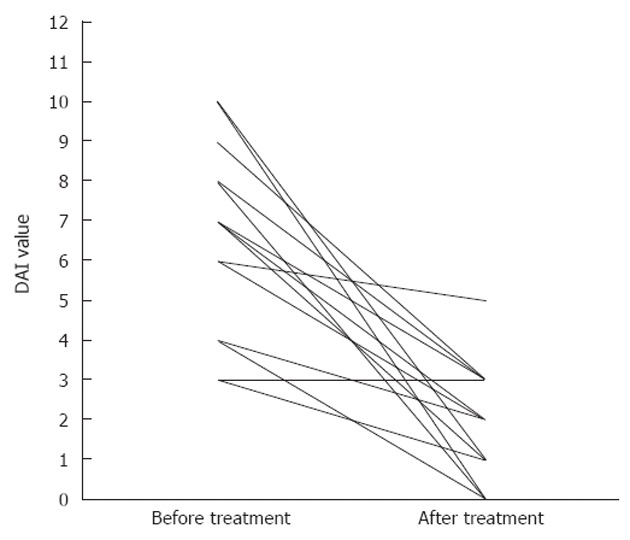
Figure 1.

Disease activity index before and after treatment in all patients. In the left part of the graph, there are disease activity index (DAI) values for every patient affected by ulcerative colitis or Crohn's disease at enrollment. In the right part of the graph, there are DAI values for every patient after treatment.
